T-Test
A T-test is a statistical method used to assess whether there is a significant difference between the means of two groups. It is commonly applied in hypothesis testing to determine if a specific process, treatment, or condition affects a population or if two groups differ significantly from each other.
There are several variations of the T-test, each suited to different data conditions and research objectives:
Independent Samples T-Test
- This test compares the means of two unrelated groups to assess if there is a significant difference between them.
- Example: Evaluating whether students taught using two different teaching methods achieve different average scores.
Paired Samples T-Test
- Also known as a dependent T-test, this method is used when the same subjects are measured twice under different conditions, such as before and after an intervention.
- Example: Measuring blood pressure levels in patients before and after administering a new medication.
One-Sample T-Test
- This test is used to compare the mean of a single sample to a known value or a theoretical expectation.
- Example: Checking whether the average test score of a group of students differs significantly from the national average.
How the T-Test Works
A T-test calculates a T-statistic, which represents the ratio of the observed difference between group means to the variation within the groups. The p-value obtained from the test indicates the probability of observing such a difference if there is no actual difference in the population.
- Null Hypothesis (H₀): Assumes that there is no significant difference between the group means.
- Alternative Hypothesis (H₁): Suggests that there is a statistically significant difference between the means.
If the p-value is below a chosen significance threshold (typically 0.05), it provides evidence to reject the null hypothesis, indicating a meaningful difference between the groups.

The t-statistic formula for an independent samples t-test is given by:

Where:
![]()
![]()
![]()
 Important Considerations Before Using the T-Test
Before applying a t-test, it is essential to verify that its assumptions hold. Specifically, the data should follow a normal distribution, and the groups being compared should have similar variances (homogeneity of variance). If these assumptions are not met, alternative statistical tests or adjustments should be considered.
When to Use a T-Test
A t-test is suitable when comparing the means of two groups (pairwise comparison). If the analysis involves more than two groups or multiple pairwise comparisons, an ANOVA or post-hoc test is recommended.
Being a parametric test, the t-test relies on certain assumptions about the data, including:
- Independence of observations
- Approximate normal distribution of the data
- Equal variance between groups (homogeneity of variance)
- Continuous data
- Random sampling from a population
If the data do not meet these criteria, a non-parametric alternative such as the Wilcoxon Signed-Rank test may be a better choice, particularly when variance is unequal.
Applications of the T-Test
The t-test is widely used across various disciplines to analyze differences between groups. Some key applications include:
- Medical Research:
- Comparing treatment outcomes in clinical trials to determine the effectiveness of medications or interventions.
- Psychology:
- Evaluating differences in behavioral studies, such as measuring responses to different stimuli in experiments.
- Education:
- Assessing variations in academic performance, teaching methods, or educational programs.
- Business and Economics:
- Analyzing consumer preferences, marketing strategies, or financial data to identify meaningful trends.
- Quality Control:
- Monitoring manufacturing processes by comparing product samples to maintain consistency and standards.
These examples illustrate how the t-test is a valuable tool in various research areas where comparing group means is necessary.
Why the T-Test is Important
The t-test plays a crucial role in statistical analysis due to several key reasons:
- Comparison of Group Means:
- It helps determine whether the difference between two groups is statistically significant, making it useful in evaluating interventions, treatments, and experimental outcomes.
- A Parametric Test with Strong Foundations:
- Since the t-test is based on mathematical principles and distribution assumptions, it provides reliable results when those assumptions are satisfied.
- Multiple Variants for Different Scenarios:
- Variants of the t-test, such as independent samples t-test, paired samples t-test, and one-sample t-test, allow researchers to choose the most appropriate method based on the study design.
- Drawing Conclusions About Populations:
- By analyzing sample data, the t-test enables researchers to infer population-level trends, which is essential in scientific and social research.
- Works Well with Small Sample Sizes:
- Unlike some statistical tests that require large datasets, the t-test can provide meaningful insights even when working with limited data.
Implementation of T-test in python
# 1. Independent Samples T-test
## Problem Statement:
A company wants to compare the performance (in terms of scores) of two different training methods for employees. The company tested Method A on a group of employees and Method B on another group. They want to know if there’s a significant difference between the average scores of these two groups.
from scipy.stats import ttest_ind

# Sample data (scores for two independent groups)
method_a = [70, 75, 80, 85, 90]
method_b = [65, 68, 72, 78, 80]

# Perform the Independent Samples T-test
t_stat, p_value = ttest_ind(method_a, method_b)
print(f'T-statistic: {t_stat}')
print(f'P-value: {p_value}')

# Interpretation
if p_value < 0.05:
    print('The means of the two groups are significantly different.')
else:
    print('There is no significant difference between the means of the two groups.')


T-statistic: 1.6280455859146188
P-value: 0.1421653681113233
There is no significant difference between the means of the two groups.

#  2. Paired Samples T-test
## Problem Statement:
A fitness trainer wants to evaluate the effectiveness of a new workout routine. She measures the body fat percentage of 10 individuals before and after following the new routine for 8 weeks. She wants to know if there’s a significant reduction in body fat percentage after the program.


from scipy.stats import ttest_rel

# Sample data (body fat percentage before and after the program)
before_program = [25, 27, 30, 26, 28]
after_program = [24, 26, 28, 25, 27]

# Perform the Paired Samples T-test
t_stat, p_value = ttest_rel(before_program, after_program)
print(f'T-statistic: {t_stat}')
print(f'P-value: {p_value}')

# Interpretation
if p_value < 0.05:
    print('There is a significant difference between the paired measurements.')
else:
    print('There is no significant difference between the paired measurements.')


T-statistic: 5.999999999999999
P-value: 0.003882537046960512
There is a significant difference between the paired measurements. 

# 3. One-Sample T-test

## Problem Statement:
A factory manager wants to test whether the average production output of a machine is different from the expected output of 500 units per day. A sample of 10 days’ production data is collected, and the manager wants to know if the machine is performing as expected.

from scipy.stats import ttest_1samp

# Sample data (production output over 10 days)
production_output = [480, 510, 495, 505, 490, 500, 515, 505, 498, 503]

# Perform the One-Sample T-test (test if the mean is different from 500)
t_stat, p_value = ttest_1samp(production_output, 500)
print(f'T-statistic: {t_stat}')
print(f'P-value: {p_value}')

# Interpretation
if p_value < 0.05:
    print('The average production is significantly different from 500 units.')
else:
    print('There is no significant difference from the expected production of 500 units.')

T-statistic: 0.03139855423453206
P-value: 0.9756369775901614
There is no significant difference from the expected production of 500 units.
Conclusion
The t-test is a widely used statistical method for comparing means and drawing conclusions about populations based on sample data. Below are key takeaways highlighting its importance and application:
- Comparing Means:
- The t-test is specifically designed to assess differences between two groups, making it a valuable tool in fields such as experimental research, clinical studies, and social sciences.
- Parametric Nature:
- Since the t-test is a parametric test, it assumes certain conditions about the data distribution. It is best suited for scenarios where these assumptions—such as normality and equal variance—are met.
- Adaptability:
- The t-test offers different variations, including independent samples t-test, paired samples t-test, and one-sample t-test, allowing researchers to select the most appropriate method based on their data structure and study design.
- Implementation in Python:
- The t-test can be performed efficiently using Python’s scipy.stats module, which provides built-in functions for various t-test types, enabling researchers to analyze data with ease.
- Ease of Interpretation:
- The outputs of a t-test, including the t-statistic and p-value, are straightforward to interpret, helping researchers determine whether differences between groups are statistically significant.
Final Thoughts
The t-test remains a fundamental statistical tool due to its simplicity, versatility, and practical application across numerous disciplines. Whether in research, healthcare, business, or education, it continues to play a crucial role in data analysis, enabling informed decision-making based on statistical evidence.
Featured Blogs

BCG Digital Acceleration Index

Bain’s Elements of Value Framework
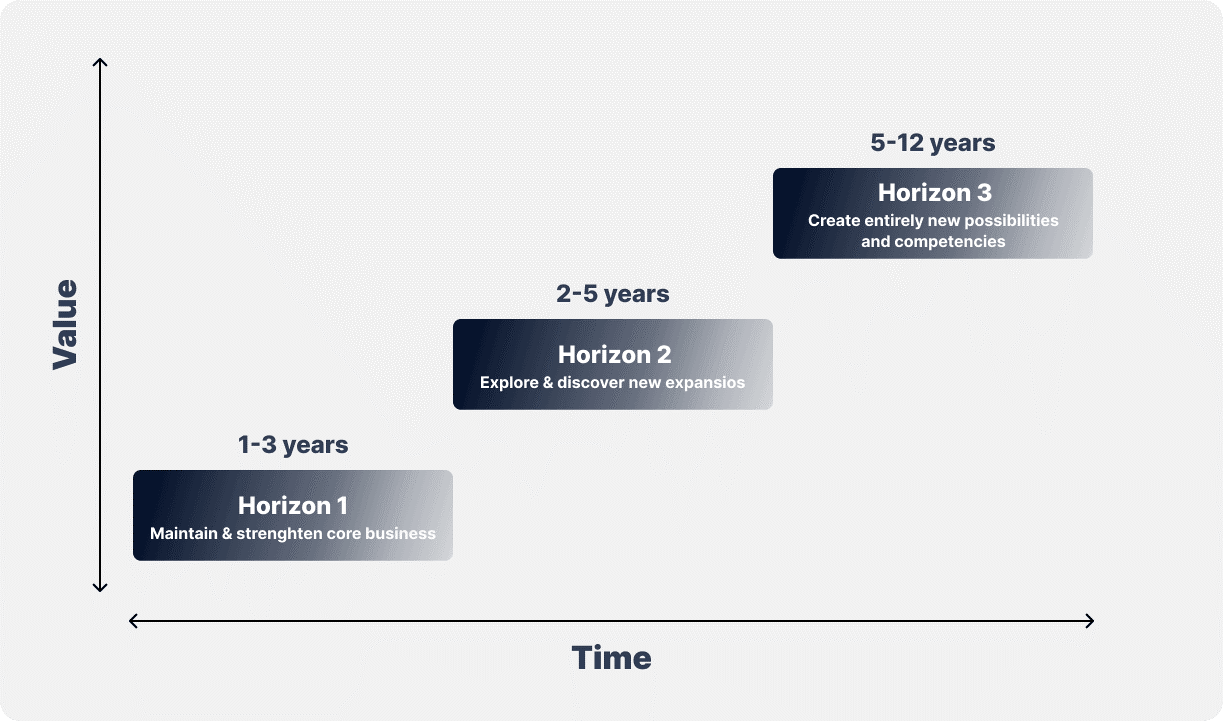
McKinsey Growth Pyramid
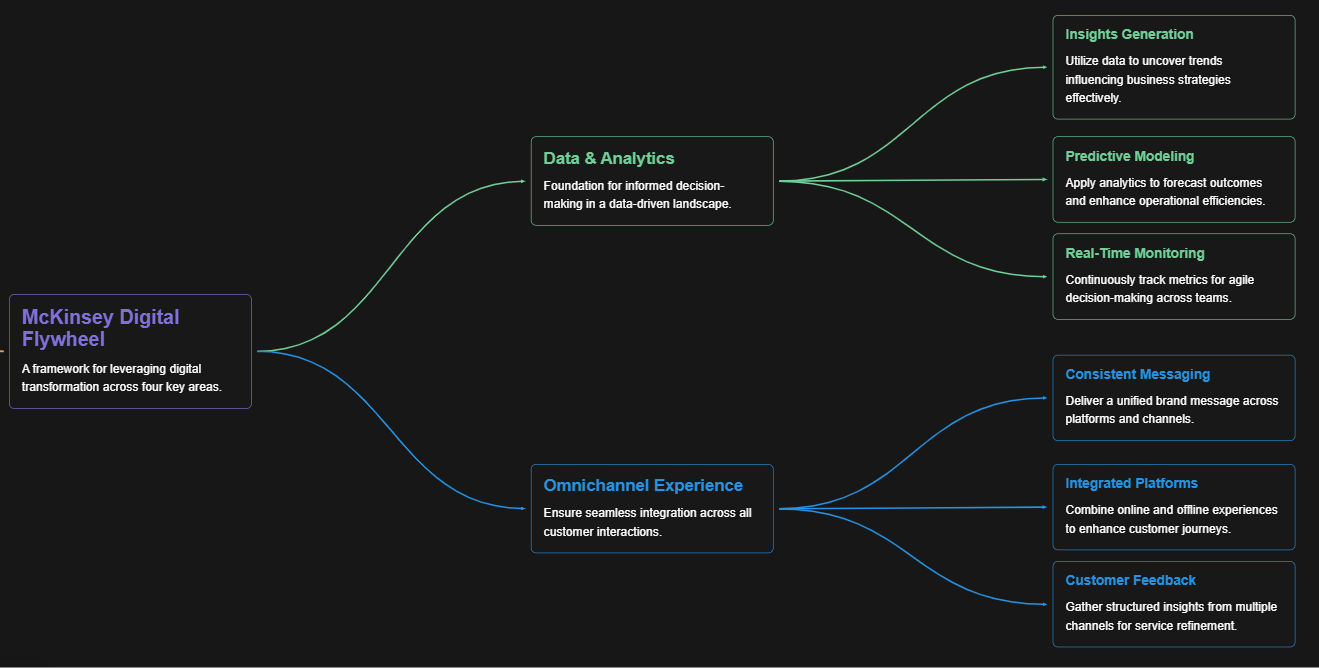
McKinsey Digital Flywheel
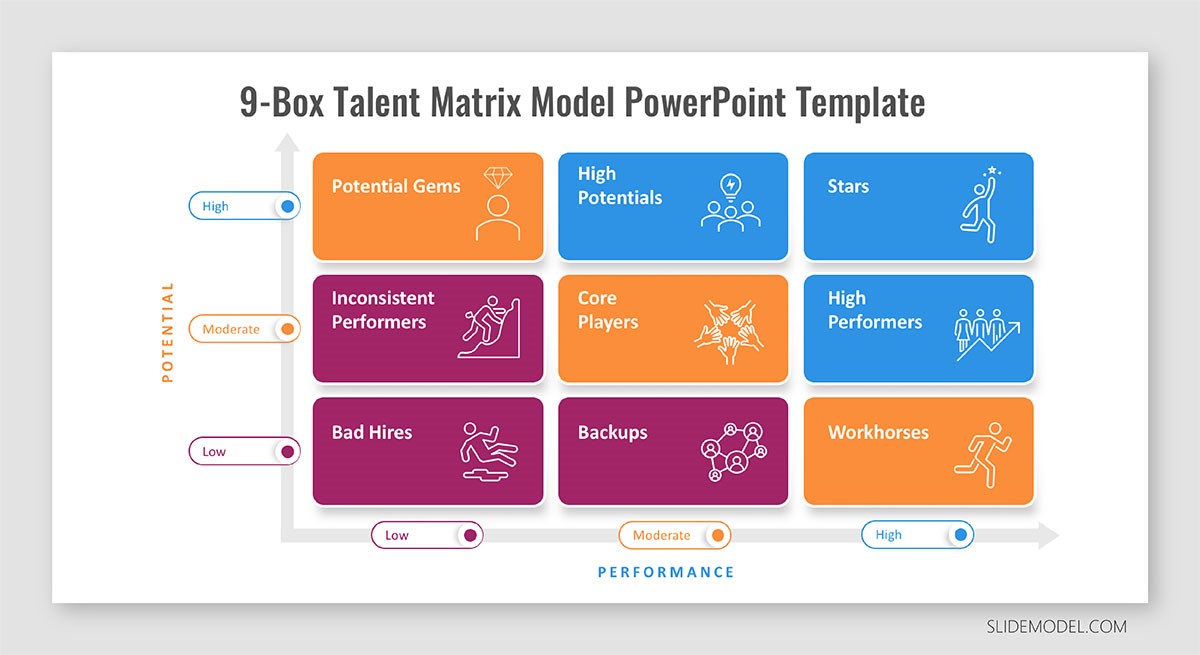
McKinsey 9-Box Talent Matrix

McKinsey 7S Framework
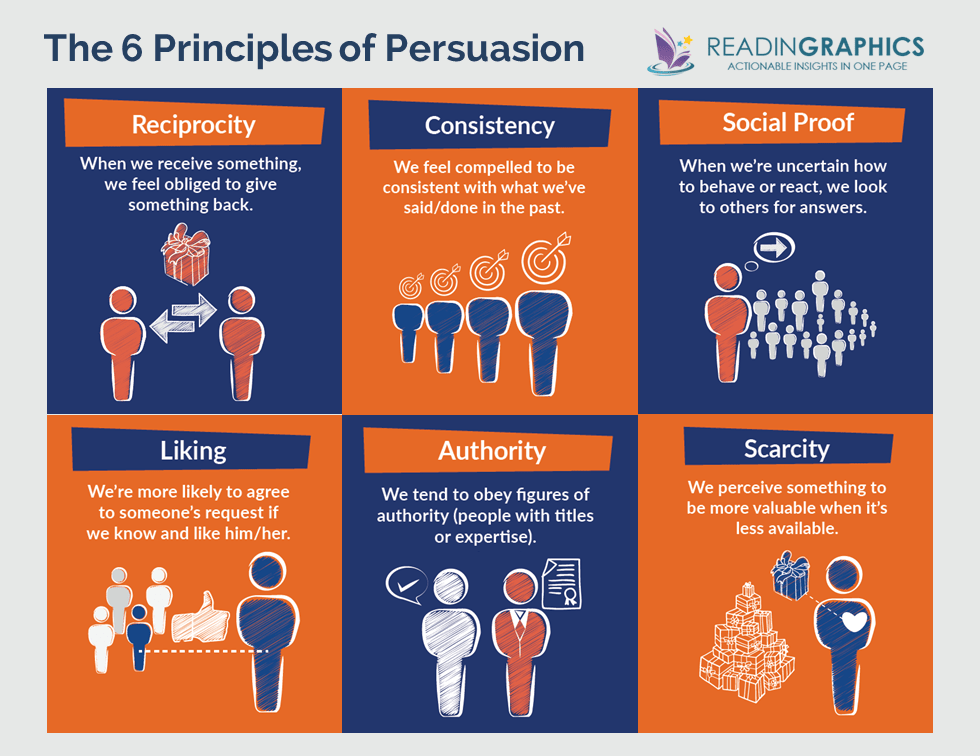
The Psychology of Persuasion in Marketing

The Influence of Colors on Branding and Marketing Psychology

What is Marketing?
Recent Blogs

Part 8: From Blocks to Brilliance – How Transformers Became Large Language Models (LLMs) of the series - From Sequences to Sentience: Building Blocks of the Transformer Revolution

Part 7: The Power of Now – Parallel Processing in Transformers of the series - From Sequences to Sentience: Building Blocks of the Transformer Revolution
Part 6: The Eyes of the Model – Self-Attention of the series - From Sequences to Sentience: Building Blocks of the Transformer Revolution

Part 5: The Generator – Transformer Decoders of the series - From Sequences to Sentience: Building Blocks of the Transformer Revolution

Part 4: The Comprehender – Transformer Encoders of the series - From Sequences to Sentience: Building Blocks of the Transformer Revolution of the series - From Sequences to Sentience: Building Blocks of the Transformer Revolution


