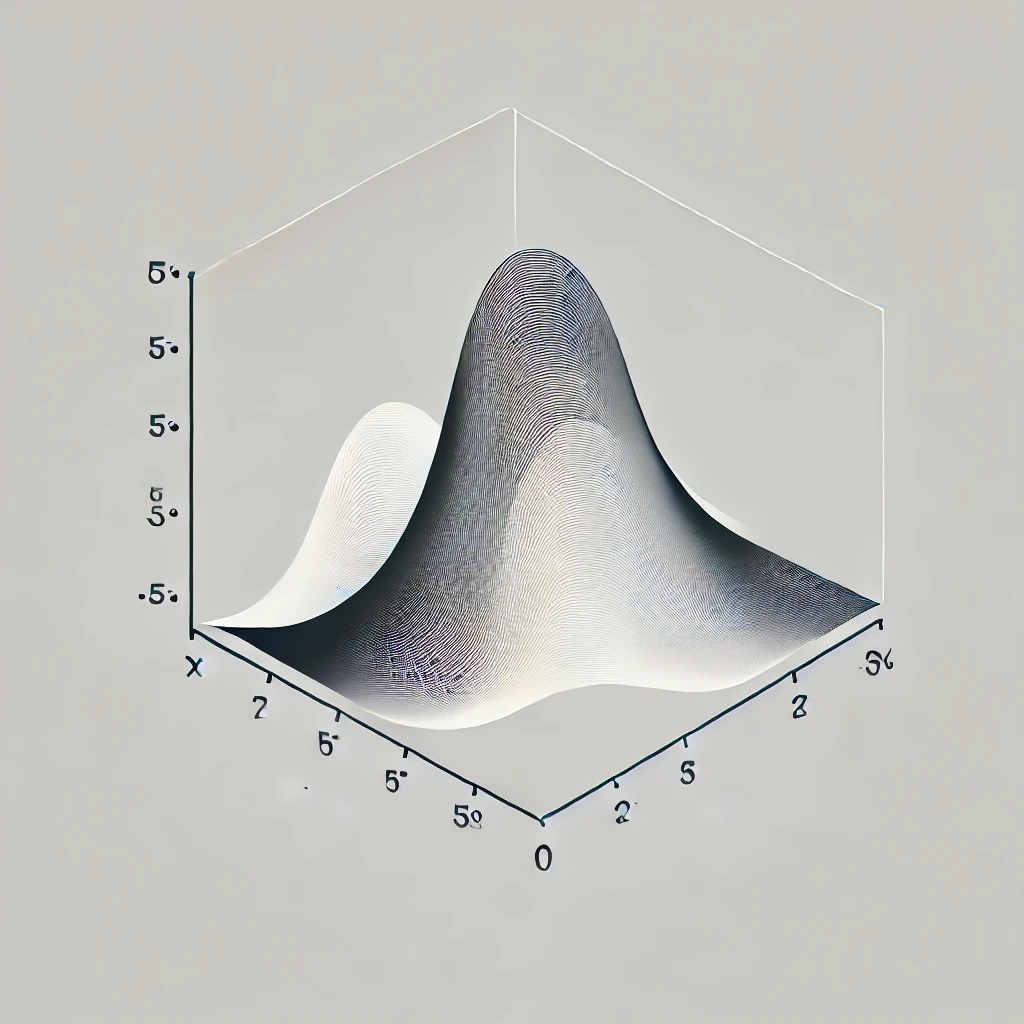
Weibull Cumulative Distribution Function
The Cumulative Distribution Function (CDF) of the Weibull distribution represents the probability that a randomly selected variable from this distribution is less than or equal to a specified value. This distribution is widely utilized in reliability engineering to analyze the lifespan of different systems and components.
The Weibull CDF is expressed as:
![]()
Applications of the Weibull Cumulative Distribution Function (CDF)
The Weibull CDF is widely applied in multiple disciplines, particularly in reliability engineering and survival analysis, where understanding failure probabilities and time-to-event behaviors is essential. Below are key applications of the Weibull CDF:
1. Reliability Engineering
- Failure Probability Estimation: The Weibull CDF helps in determining the probability that a system or component will fail by a certain time, making it a fundamental tool in reliability analysis.
- Lifecycle Analysis: It is instrumental in analyzing the bathtub curve, which depicts different failure phases: early failures (infant mortality), a stable operational period, and an eventual wear-out phase.
2. Survival Analysis
- Time-to-Event Modeling: The Weibull CDF is commonly used in survival analysis to predict the likelihood of an event, such as failure, disease progression, or recovery, occurring within a specific timeframe.
- Hazard Function Insights: By deriving the hazard function from the Weibull CDF, researchers can examine the instantaneous risk of an event happening at any given moment.
3. Quality Control and Manufacturing
- Product Longevity Assessment: In quality control, the Weibull CDF helps manufacturers estimate the probability of a product surviving beyond a given period.
- Predictive Maintenance Planning: Understanding failure probabilities assists in determining optimal maintenance schedules, reducing operational risks.
Importance of the Weibull CDF
The Weibull CDF plays a critical role in analyzing time-dependent probabilities across multiple domains. Its flexibility allows it to model a variety of failure and survival patterns, making it a powerful tool in statistical modeling.
Key Advantages:
- Reliability Engineering: Helps in predicting failure rates and optimizing system reliability.
- Medical and Biological Studies: Assists in analyzing survival probabilities and treatment effectiveness.
- Industrial Applications: Enhances product quality assessment and maintenance planning.
Implementation of Weibull CDF in python
import numpy as np
import matplotlib.pyplot as plt
from scipy.stats import weibull_min
def plot_weibull_cdf(lambda_param, k_params, x_range):
    """
    Plots Weibull Cumulative Distribution Functions for multiple shape parameters.

    Args:
    - lambda_param: Scale parameter (λ) for the Weibull distribution.
    - k_params: List of shape parameters (k) for the Weibull distribution.
    - x_range: Range of x-values to compute the CDF.
    """
    plt.figure(figsize=(10, 6))
    for k_param in k_params:
        weibull_cdf_values = weibull_min.cdf(x_range, c=k_param, scale=lambda_param)
        plt.plot(x_range, weibull_cdf_values, label=f'λ={lambda_param}, k={k_param}')

    plt.title('Weibull Cumulative Distribution Function (CDF)')
    plt.xlabel('x')
    plt.ylabel('CDF')
    plt.legend(title="Weibull CDFs", loc="best")
    plt.grid(True)
    plt.show()

# Define scale parameter and a list of shape parameters
lambda_param = 10  # Scale parameter (λ)
k_params = [0.5, 1, 2, 4]  # Different shape parameters (k)
x_values = np.linspace(0, 30, 500)  # x-values from 0 to 30

# Plot the Weibull CDFs for the specified shape parameters
plot_weibull_cdf(lambda_param, k_params, x_values)

def plot_weibull_cdf_scale_comparison(k_param, lambda_params, x_range):
    """
    Plots Weibull Cumulative Distribution Functions for multiple scale parameters.

    Args:
    - k_param: Shape parameter (k) for the Weibull distribution.
    - lambda_params: List of scale parameters (λ) for the Weibull distribution.
    - x_range: Range of x-values to compute the CDF.
    """
    plt.figure(figsize=(10, 6))
    for lambda_param in lambda_params:
        weibull_cdf_values = weibull_min.cdf(x_range, c=k_param, scale=lambda_param)
        plt.plot(x_range, weibull_cdf_values, label=f'λ={lambda_param}, k={k_param}')

    plt.title('Weibull CDF with Different Scale Parameters (k constant)')
    plt.xlabel('x')
    plt.ylabel('CDF')
    plt.legend(title="Weibull CDFs", loc="best")
    plt.grid(True)
    plt.show()

# Define shape parameter and a list of scale parameters
k_param = 2  # Shape parameter (k)
lambda_params = [5, 10, 15]  # Different scale parameters (λ)

# Plot the Weibull CDFs for the specified scale parameters
plot_weibull_cdf_scale_comparison(k_param, lambda_params, x_values)

Conclusion
The Cumulative Distribution Function (CDF) of the Weibull distribution is a crucial statistical tool with broad applications across multiple fields. Its adaptability and ease of interpretation make it highly effective for analyzing time-to-event data. The Weibull CDF’s flexibility enables it to represent various failure and survival trends, making it an essential resource for researchers, engineers, and decision-makers in assessing reliability, predicting lifetimes, and improving system performance.
Featured Blogs

BCG Digital Acceleration Index
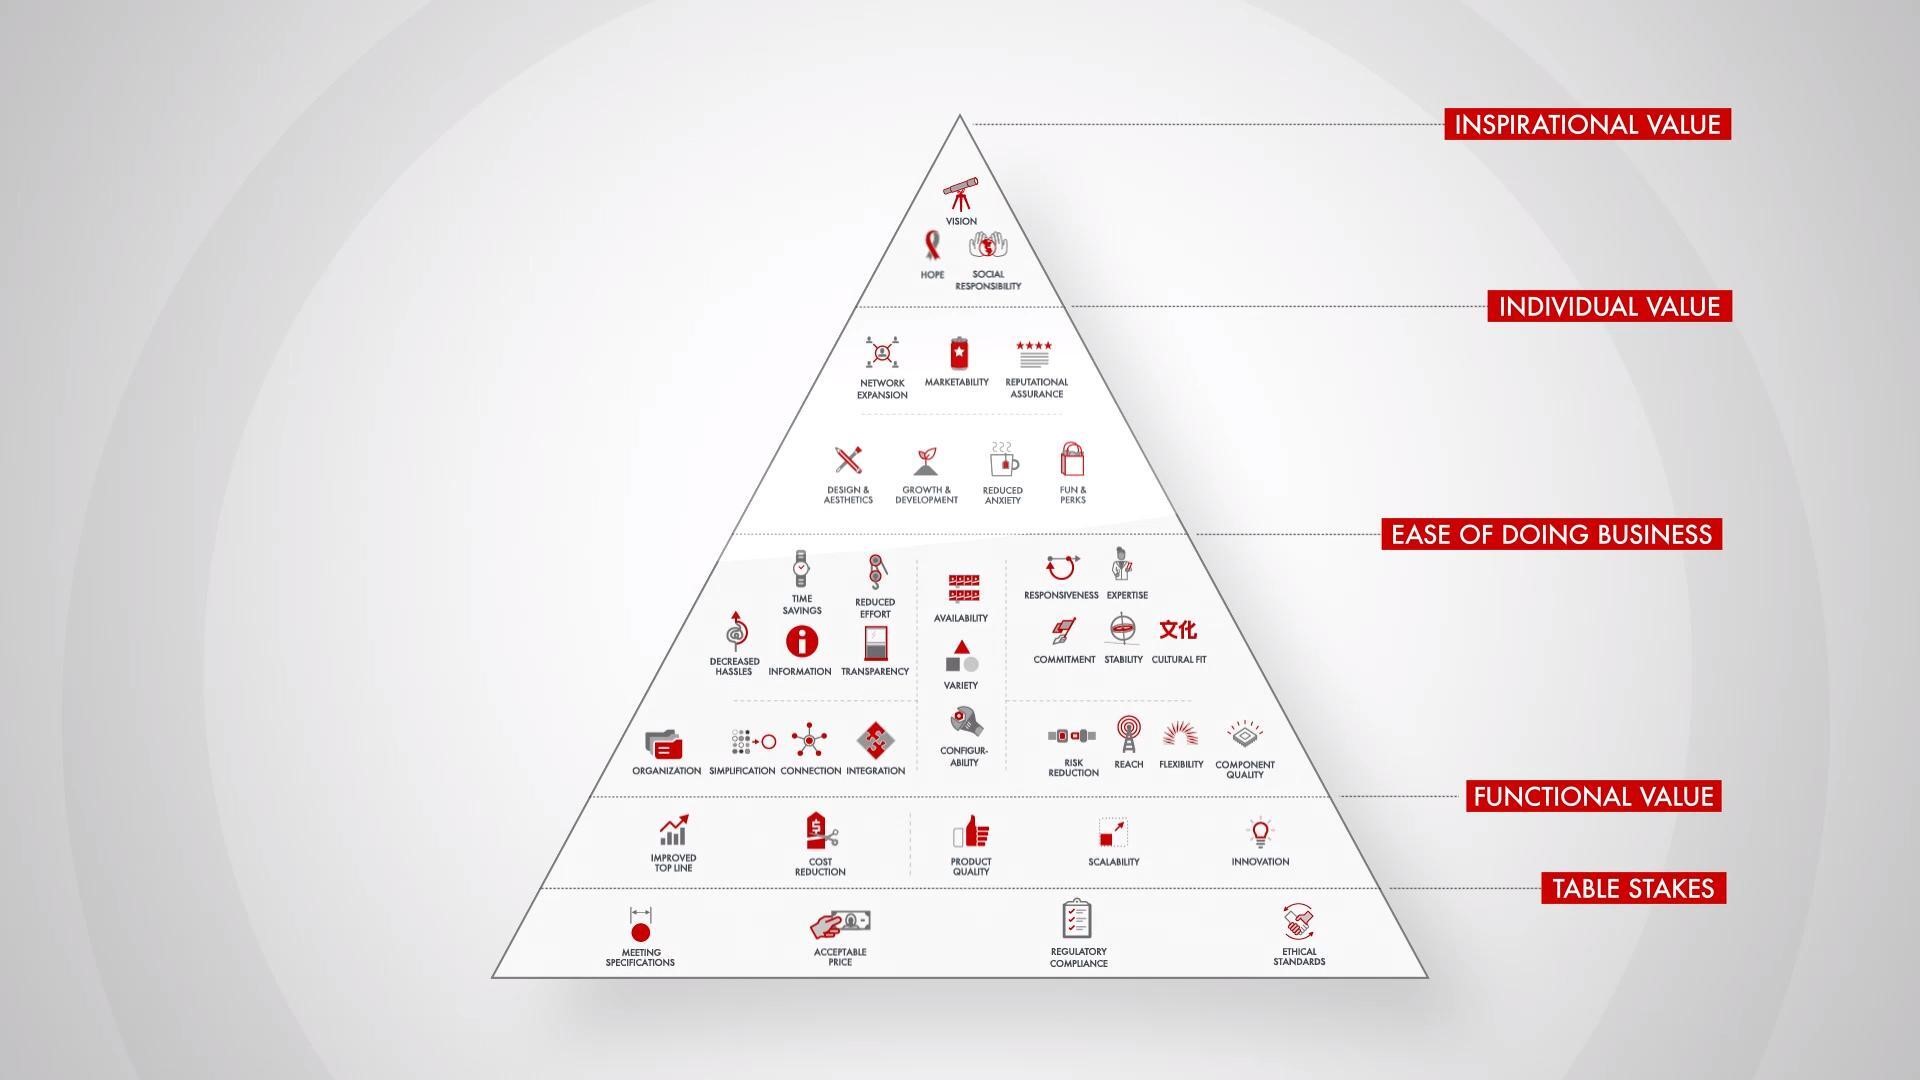
Bain’s Elements of Value Framework
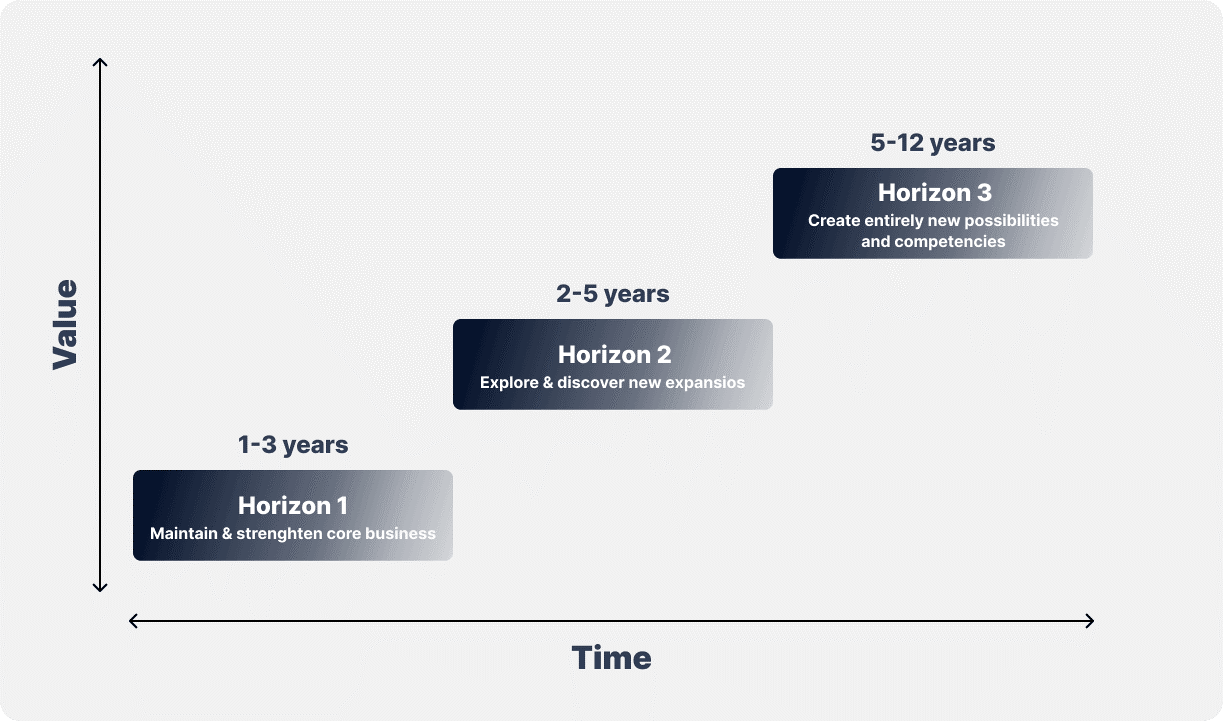
McKinsey Growth Pyramid
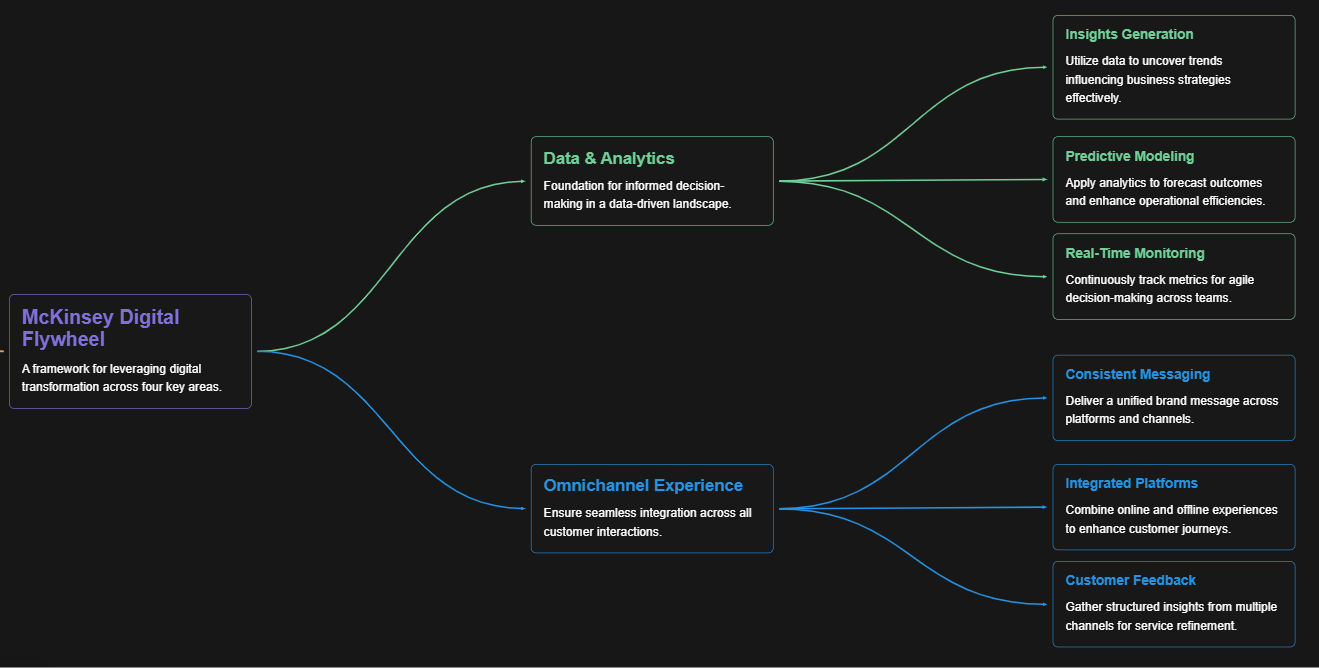
McKinsey Digital Flywheel
McKinsey 9-Box Talent Matrix

McKinsey 7S Framework

The Psychology of Persuasion in Marketing

The Influence of Colors on Branding and Marketing Psychology

What is Marketing?
Recent Blogs

Part 8: From Blocks to Brilliance – How Transformers Became Large Language Models (LLMs) of the series - From Sequences to Sentience: Building Blocks of the Transformer Revolution

Part 7: The Power of Now – Parallel Processing in Transformers of the series - From Sequences to Sentience: Building Blocks of the Transformer Revolution

Part 6: The Eyes of the Model – Self-Attention of the series - From Sequences to Sentience: Building Blocks of the Transformer Revolution

Part 5: The Generator – Transformer Decoders of the series - From Sequences to Sentience: Building Blocks of the Transformer Revolution

Part 4: The Comprehender – Transformer Encoders of the series - From Sequences to Sentience: Building Blocks of the Transformer Revolution of the series - From Sequences to Sentience: Building Blocks of the Transformer Revolution


