
Standard Error
The standard error of the mean (SE or SEM) is a statistical measure that indicates how much the sample mean is expected to deviate from the true population mean. It provides insight into the reliability of a sample in estimating the population parameter. If multiple samples were drawn from the same population, the standard error would show how much their means would typically vary.
While the standard error of the mean is the most commonly used, standard errors can also be calculated for other statistics, such as medians and proportions. It is a key indicator of sampling error—the difference between a sample statistic and the actual population parameter.
Table of Contents:
- Importance of Standard Error
- Applications of Standard Error
- Significance of Standard Error
- Implementing Standard Error in Python
- Conclusion
Importance of Standard Error
In statistical analysis, samples are used to make inferences about larger populations. The standard error is crucial because it helps determine how accurately a sample represents the entire population.
When probability sampling is used—where sample elements are randomly selected—the data is more likely to reflect the population characteristics. However, even with probability sampling, some sampling error will always exist since a sample is rarely a perfect representation of the population.
By calculating the standard error, researchers can assess the reliability of their sample and make informed conclusions.
- A higher standard error indicates that sample means are widely dispersed around the population mean, suggesting that the sample may not be highly representative.
- A lower standard error means that sample means are closely clustered around the population mean, indicating better representation.
One effective way to reduce the standard error is by increasing the sample size. A larger, well-randomized sample helps minimize sampling bias and improves the accuracy of population estimates.
Standard Error vs. Standard Deviation
Both standard error and standard deviation are used to measure variability, but they serve different purposes:
- Standard deviation quantifies the spread of data within a single sample.
- Standard error measures the variability of sample means when multiple samples are drawn from the same population.
Standard deviation is a descriptive statistic calculated directly from a dataset, whereas standard error is an inferential statistic estimated to assess population-level variability.
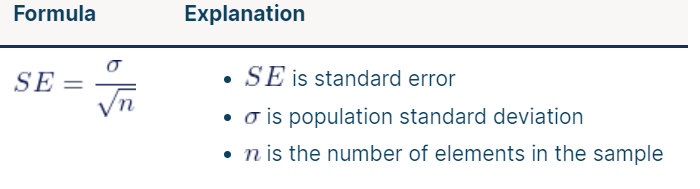
Standard Error Formula
The standard error of the mean is derived from the standard deviation and the sample size. The formula indicates an inverse relationship between sample size and standard error—meaning that as the sample size increases, the standard error decreases. A larger sample provides a more precise estimate of the population mean.
Different formulas apply depending on whether the population standard deviation is known. These formulas are typically used when the sample size is greater than 20 (n > 20).
If the population standard deviation is known, it can be directly used to calculate the standard error, providing a precise estimate.
When Population Parameters Are Unknown
If the population standard deviation is not known, the standard error can only be estimated. In this case, the sample standard deviation is used as an approximation for the population standard deviation in the calculation. The following formula provides an estimate of the standard error based on sample data.

Applications of Standard Error
Standard Error (SE) is a vital statistical tool that helps measure how accurately a sample represents a population. It plays a key role in hypothesis testing, confidence intervals, and various statistical analyses. Some of its primary applications include:
- Confidence Intervals
- Estimating Population Parameters: Standard error is used to construct confidence intervals around sample means, offering a range within which the true population mean is expected to fall. This is widely applied in survey research and medical studies.
- Hypothesis Testing
- T-tests and Z-tests: SE is used in statistical tests such as t-tests and z-tests to assess whether the observed sample mean significantly deviates from an expected population mean.
- Regression Analysis
- Estimating Coefficients: In regression models, the standard error of regression coefficients helps evaluate the reliability of the estimated relationships between independent and dependent variables. Lower SE values suggest more precise estimates.
- Sampling and Polling
- Election Polls: SE is crucial in polling data interpretation, as it helps calculate the margin of error, indicating how well the sample reflects the broader population’s opinions.
- Quality Control and Manufacturing
- Assessing Process Variation: SE is used in manufacturing to evaluate how well a sample of products represents an entire production batch, aiding in quality assurance.
Importance of Standard Error
Standard Error is significant because it quantifies the degree of variability in sampling and helps assess how well a sample statistic (such as the sample mean) approximates a population parameter. Key reasons why SE is important include:
- Indicator of Precision
- SE provides a numerical measure of estimate accuracy. A lower SE suggests that the sample mean closely represents the true population mean, while a higher SE indicates more variability.
- Foundation for Inferential Statistics
- SE is a crucial element in inferential statistics, forming the basis for hypothesis testing and confidence interval calculations, allowing researchers to make data-driven conclusions.
- Effect of Sample Size
- SE decreases as the sample size increases, emphasizing the importance of larger samples in producing more reliable population estimates. This is essential in research study design.
- Comparison Across Studies
- SE allows for the comparison of results across different studies or experiments, even when sample sizes differ. This normalization helps in meta-analyses and broader statistical evaluations.
Implementation of standard error in python
import numpy as np
import matplotlib.pyplot as plt
# Function to calculate the standard error of the mean
def standard_error(data):
    return np.std(data, ddof=1) / np.sqrt(len(data))
# Generate a population of 10,000 values from a normal distribution (mean=50, std=10)
population = np.random.normal(50, 10, 10000)
# Simulate taking multiple samples of different sizes and calculate the standard error
sample_sizes = np.arange(10, 1001, 50)  # Sample sizes from 10 to 1000
standard_errors = []
for size in sample_sizes:
    sample = np.random.choice(population, size, replace=False)
    se = standard_error(sample)
    standard_errors.append(se)
# Plot the standard error as a function of sample size
plt.plot(sample_sizes, standard_errors, marker='o', linestyle='-', color='b')
plt.title('Standard Error vs Sample Size')
plt.xlabel('Sample Size')
plt.ylabel('Standard Error')
plt.grid(True)
plt.show()
The graph shows that the standard error decreases as the sample size increases. This demonstrates that larger samples yield more precise estimates of the population mean.
This visualization helps you understand the concept of sampling variability and why larger sample sizes are important for improving the reliability of estimates.
Standard Error (SE) using scipy.stats.sem
import numpy as np
from scipy import stats
sample_data = np.array([75, 80, 85, 70, 90])
# Calculate the standard error of the mean
standard_error = stats.sem(sample_data)
# Output
print(f"Sample Data: {sample_data}")
print(f"Standard Error of the Mean: {standard_error:.2f}")
Sample Data: [75 80 85 70 90]
Standard Error of the Mean: 3.54Conclusion
The Standard Error is a fundamental statistical measure that evaluates the variability and accuracy of sample estimates in relation to population parameters. Key insights include:
- Precision of Sample Estimates
- Standard Error helps determine how closely a sample statistic (such as the sample mean) reflects the true population value. A lower SE indicates greater reliability of the sample representation.
- Core Element of Statistical Analysis
- SE is essential in hypothesis testing and confidence interval construction. Understanding SE is crucial for drawing meaningful conclusions from sample data and assessing the significance of observed differences.
- Influence of Sample Size
- SE decreases as sample size increases, highlighting its role in determining the required sample size for accurate population estimates. This is particularly important in experimental design, surveys, and data collection strategies.
Overall, the Standard Error is a crucial statistical tool that enables precise and reliable inferences. It supports decision-making across various disciplines, including research, economics, social sciences, and business analytics, facilitating data-driven insights based on sample data.
Featured Blogs

BCG Digital Acceleration Index

Bain’s Elements of Value Framework

McKinsey Growth Pyramid

McKinsey Digital Flywheel

McKinsey 9-Box Talent Matrix

McKinsey 7S Framework

The Psychology of Persuasion in Marketing

The Influence of Colors on Branding and Marketing Psychology

What is Marketing?
Recent Blogs

Part 8: From Blocks to Brilliance – How Transformers Became Large Language Models (LLMs) of the series - From Sequences to Sentience: Building Blocks of the Transformer Revolution

Part 7: The Power of Now – Parallel Processing in Transformers of the series - From Sequences to Sentience: Building Blocks of the Transformer Revolution

Part 6: The Eyes of the Model – Self-Attention of the series - From Sequences to Sentience: Building Blocks of the Transformer Revolution

Part 5: The Generator – Transformer Decoders of the series - From Sequences to Sentience: Building Blocks of the Transformer Revolution

Part 4: The Comprehender – Transformer Encoders of the series - From Sequences to Sentience: Building Blocks of the Transformer Revolution of the series - From Sequences to Sentience: Building Blocks of the Transformer Revolution
