Standard deviation
Standard deviation is a key statistical measure that quantifies the extent of variation or dispersion within a dataset. It provides insights into how much individual values differ from the mean (average). A high standard deviation indicates that values are more spread out, whereas a low standard deviation suggests that values are closely clustered around the mean.
In normally distributed data, values are symmetrically arranged around the center, with most observations concentrated near the mean and fewer appearing as the distance from the mean increases. Standard deviation helps assess how widely data points deviate from this central value.
Table of Contents
- Definition of Standard Deviation
- Practical Applications
- Importance of Standard Deviation
- Implementing Standard Deviation in Python
- Conclusion
What is Standard Deviation?
Standard deviation measures the degree of variability in a dataset by assessing how far individual values are from the mean. It provides an understanding of data consistency—small values indicate minimal variation, while large values suggest greater spread.
Formulas for Standard Deviation
The calculation of standard deviation depends on whether the dataset represents an entire population or a sample.
- Population Standard Deviation
- Used when data is gathered from the entire group of interest, providing an exact measure of dispersion.
- Sample Standard Deviation
- Applied when analyzing a subset of the population to estimate variability. The formula adjusts for bias by using (n - 1) instead of n to prevent underestimation of true variation.
Calculating Standard Deviation
Standard deviation is typically computed using statistical software, but it can also be determined manually through the following steps:
Example Data Set: 46, 69, 32, 60, 52, 41
- Determine the Mean
- Sum all values and divide by the total number of observations.
- Calculate Deviations from the Mean
- Subtract the mean from each value.
- Square Each Deviation
- Squaring ensures all deviations are positive.
- Compute the Sum of Squares
- Add up the squared values.
- Find the Variance
- Divide the sum of squares by (n - 1) for samples or N for populations.
- Extract the Square Root
- The standard deviation is the square root of the variance.
For this dataset, the calculated standard deviation is 13.31, meaning the average deviation from the mean is 13.31 points.
Applications of Standard Deviation
Standard deviation is widely used across industries and research fields:
- Finance and Investment:
- Measures volatility in stock prices and investment portfolios to assess risk.
- Manufacturing and Quality Control:
- Ensures product consistency by monitoring variations in production.
- Economics and Business:
- Analyzes fluctuations in economic indicators like inflation and GDP.
- Education and Assessments:
- Evaluates score distribution in tests to determine performance consistency.
- Social Sciences and Psychology:
- Helps in studying behavioral data by measuring variability in responses.
Importance of Standard Deviation
Standard deviation plays a crucial role in data analysis by providing insights into the reliability and consistency of information:
- Quantifies Variability – Helps determine how much individual values differ from the mean.
- Risk Evaluation in Finance – Assesses price volatility in investments.
- Ensures Product Quality – Identifies inconsistencies in manufacturing.
- Enhances Data Interpretation – Indicates whether data points are closely packed or widely spread.
- Aids Decision-Making in Education – Helps analyze student performance trends.
Implementation of Standard deviation in Python
import numpy as np
import matplotlib.pyplot as plt
import statistics
# Sample data
data = [2, 4, 4, 4, 5, 5, 7, 9]
# Step 1: Calculate Mean
mean = np.mean(data)
# Step 2: Calculate Variance
variance = np.mean([(x - mean) ** 2 for x in data])
# Step 3: Calculate Standard Deviation (Manually)
std_dev_manual = np.sqrt(variance)
# Step 4: Calculate Standard Deviation using NumPy
std_dev_np = np.std(data, ddof=0)  # For population std deviation
# Step 5: Calculate Standard Deviation using statistics module (Sample)
std_dev_stat = statistics.stdev(data)  # By default, stdev() calculates sample standard deviation
# Print the results
print(f"Mean: {mean}")
print(f"Variance: {variance}")
print(f"Standard Deviation (Manual): {std_dev_manual}")
print(f"Standard Deviation (NumPy): {std_dev_np}")
print(f"Standard Deviation (statistics): {std_dev_stat}")
# Step 6: Visualization (Histogram and Mean/Std Dev Lines)
plt.figure(figsize=(10, 6))
plt.hist(data, bins=5, edgecolor='black', alpha=0.7)
# Plot Mean and Standard Deviation lines
plt.axvline(mean, color='red', label=f'Mean: {mean:.2f}')
plt.axvline(mean + std_dev_np, color='green', linestyle='--', label=f'+1 Std Dev: {mean + std_dev_np:.2f}')
plt.axvline(mean - std_dev_np, color='green', linestyle='--', label=f'-1 Std Dev: {mean - std_dev_np:.2f}')
# Add labels and legend
plt.title('Data Distribution with Mean and Standard Deviation')
plt.xlabel('Data Points')
plt.ylabel('Frequency')
plt.legend()
plt.show()
Conclusion
Standard deviation is a key statistical measure that helps quantify the spread or variability of data within a dataset. It provides valuable insights into how data points deviate from the mean, making it an essential tool across various domains. Below are some key aspects highlighting its significance:
- Measuring Data Dispersion:
- Standard deviation numerically represents how much individual values differ from the mean, helping to assess the distribution of data.
- Financial Risk Analysis:
- In finance, it serves as a critical indicator of market volatility and investment risk, enabling investors to make well-informed decisions.
- Quality Control in Production:
- Standard deviation plays a crucial role in manufacturing by identifying inconsistencies in production processes, ensuring product quality and uniformity.
- Data Analysis and Interpretation:
- It helps analysts assess data distributions, compare datasets, and draw meaningful conclusions from statistical findings.
- Scientific Accuracy and Precision:
- In research and experiments, standard deviation is used to evaluate the reliability of results, measure uncertainties, and enhance the accuracy of findings.
Final Thoughts
As a fundamental statistical tool, standard deviation is widely applied in various fields, from finance and manufacturing to scientific research and data analysis. Its ability to measure variability makes it an essential component for researchers, analysts, and decision-makers in understanding data trends and making well-supported conclusions.
Featured Blogs

BCG Digital Acceleration Index

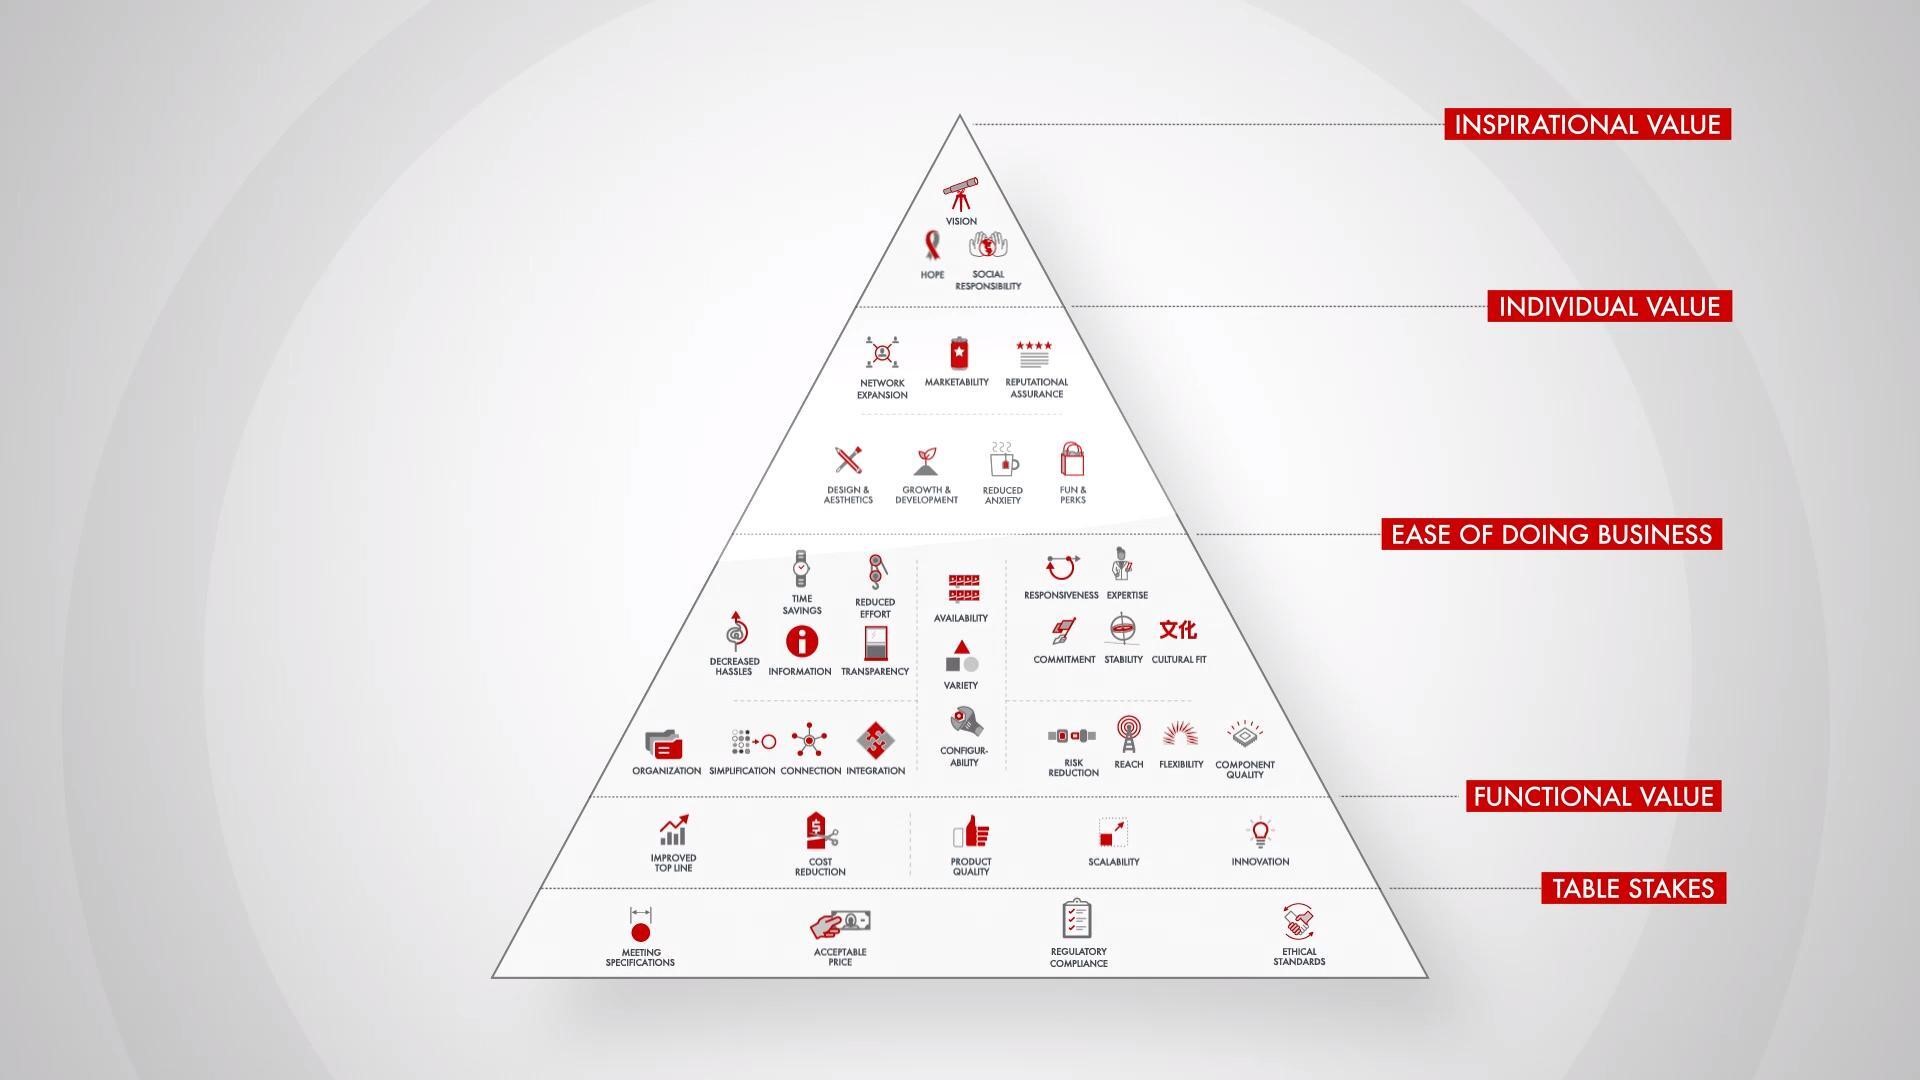
Bain’s Elements of Value Framework

McKinsey Growth Pyramid

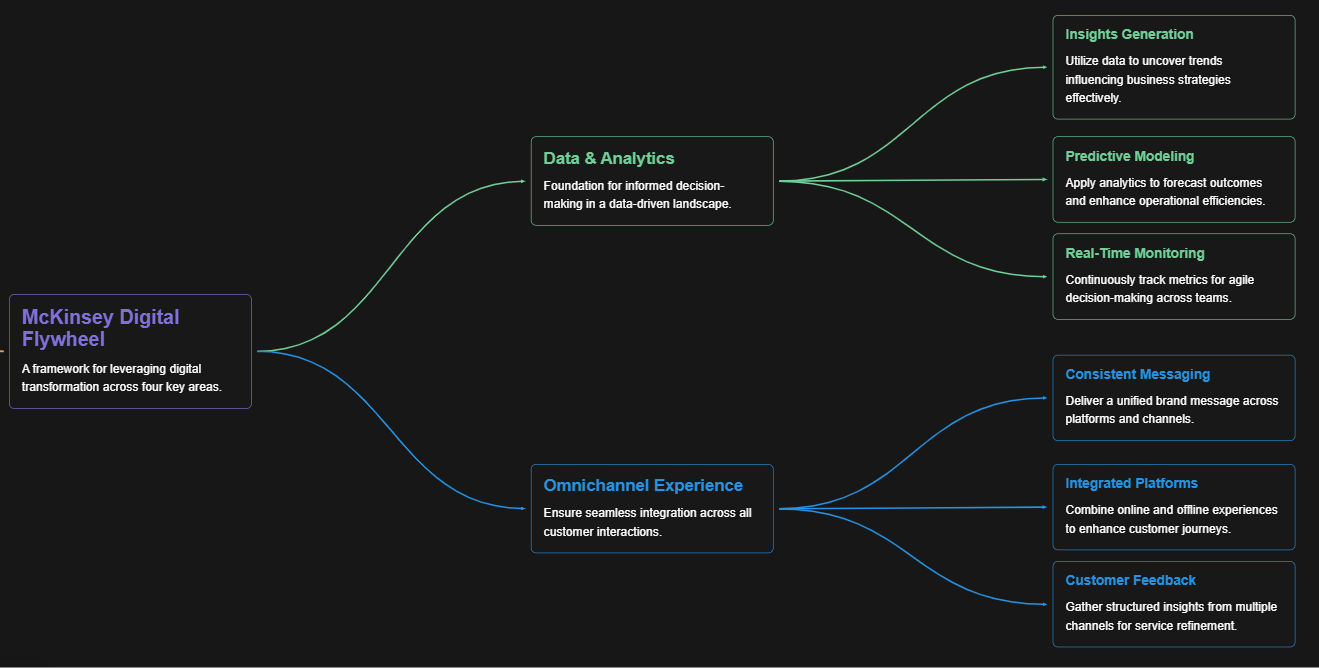
McKinsey Digital Flywheel

McKinsey 9-Box Talent Matrix

McKinsey 7S Framework

The Psychology of Persuasion in Marketing

The Influence of Colors on Branding and Marketing Psychology

What is Marketing?
Recent Blogs

Part 8: From Blocks to Brilliance – How Transformers Became Large Language Models (LLMs) of the series - From Sequences to Sentience: Building Blocks of the Transformer Revolution

Part 7: The Power of Now – Parallel Processing in Transformers of the series - From Sequences to Sentience: Building Blocks of the Transformer Revolution

Part 6: The Eyes of the Model – Self-Attention of the series - From Sequences to Sentience: Building Blocks of the Transformer Revolution

Part 5: The Generator – Transformer Decoders of the series - From Sequences to Sentience: Building Blocks of the Transformer Revolution

Part 4: The Comprehender – Transformer Encoders of the series - From Sequences to Sentience: Building Blocks of the Transformer Revolution of the series - From Sequences to Sentience: Building Blocks of the Transformer Revolution


