Logistic Regression and Odds Ratio
Logistic regression is one of the most fundamental and widely used statistical models in predictive analytics and machine learning. Unlike linear regression, which predicts continuous outcomes, logistic regression is used for binary classification problems where the dependent variable has only two possible outcomes (e.g., Yes/No, 0/1, True/False). One of the key concepts associated with logistic regression is the odds ratio, which provides insights into the likelihood of an event occurring relative to another.
Table of Contents
- Understanding Logistic Regression and Odds Ratio
- Logistic Regression: Definition and Mathematical Formulation
- Sigmoid Function and Log-Odds
- Maximum Likelihood Estimation (MLE)
- Interpretation of Model Coefficients
- Assumptions of Logistic Regression
- Odds Ratio: Definition and Importance
- Relationship Between Logistic Regression and Odds Ratio
- Model Evaluation Metrics
2. Applications
3. Significance
4. Implementation in Python
5. Conclusion
Understanding Logistic Regression and Odds Ratio
Logistic Regression: Definition and Mathematical Formulation
Logistic regression is a statistical method for analyzing datasets where the dependent variable is categorical. It predicts the probability P(Y = 1) given a set of independent variables. The general logistic regression model is:
![]()
where:
 is the probability of the event occurring,
 is the intercept,
 are regression coefficients,
 are independent variables,
 is the base of the natural logarithm.
Sigmoid Function and Log-Odds
The logistic regression model is built on the sigmoid function, which ensures that predicted probabilities are between 0 and 1:
![]()
Where z is a linear combination of the independent variables.
Taking the logit transformation, we obtain:
![]()
This shows that logistic regression models the log-odds of the dependent variable.
Maximum Likelihood Estimation (MLE)
Unlike linear regression, which uses Ordinary Least Squares (OLS), logistic regression employs Maximum Likelihood Estimation (MLE) to find optimal values of the coefficients that maximize the likelihood of observed outcomes.
Interpretation of Model Coefficients
- The coefficients (
 ) represent changes in the log-odds for a unit increase in the independent variable.
 - Exponentiating these coefficients (
 ) gives the odds ratio
Assumptions of Logistic Regression
- The dependent variable should be binary.
- Observations should be independent.
- There should be no extreme multicollinearity among independent variables.
- The independent variables should have a linear relationship with the log-odds of the dependent variable.
Odds Ratio: Definition and Importance
The odds ratio (OR) measures the strength of association between an independent variable and the dependent outcome.
![]()
- OR > 1: Higher odds of the event occurring.
- OR < 1: Lower odds of the event occurring.
- OR = 1: No effect on the odds.
Relationship Between Logistic Regression and Odds Ratio
In logistic regression, the odds ratio is derived from the model coefficients. Specifically, exponentiating the regression coefficient ![]() of an independent variable gives the corresponding odds ratio.
of an independent variable gives the corresponding odds ratio.
![]()
This means that for every one-unit increase in the independent variable ![]() , the odds of the dependent event occurring are multiplied by
, the odds of the dependent event occurring are multiplied by ![]() .
.
For example:
- If
 , then
  . This means that for every unit increase in
  , the odds of the event occurring increase by 65%.
 - If
 , then
  , indicating that the odds of the event occurring decrease by 50%.
The odds ratio helps interpret the impact of each predictor on the outcome probability, making logistic regression a powerful tool for understanding relationships between variables in binary classification problems.
Model Evaluation Metrics
- Accuracy
- Precision, Recall, and F1-score
- ROC-AUC Curve
- Confusion Matrix
Applications of Logistic Regression and Odds Ratio
1. Healthcare & Medical Research
- Disease Prediction:
- Logistic regression helps predict diseases like diabetes and cancer.
- Example: Predicting whether a person has diabetes based on age, BMI, and glucose levels. If the model outputs 0.8, it means an 80% chance of having diabetes.
- Risk Factor Analysis (Odds Ratio):
- Used to analyze how strongly a factor (e.g., smoking) is linked to a disease.
- Example: If the odds ratio for smoking and lung cancer is 3.0, it means smokers are 3 times more likely to develop lung cancer than non-smokers.
- Treatment Effectiveness:
- Compares different treatments using odds ratios.
- Example: If a new drug has an odds ratio of 1.5 for curing a disease, it means the drug is 50% more effective than the standard treatment.
2. Finance & Banking
- Credit Scoring & Loan Approval:
- Banks predict whether an applicant will default on a loan.
- Example: If a person has a low credit score, the model may output a 90% probability of default, leading to a loan rejection.
- Fraud Detection:
- Logistic regression classifies transactions as fraud or genuine.
- Example: A bank analyzes spending patterns and flags a transaction with 95% probability of fraud, triggering an alert.
3. Marketing & Customer Analytics
- Customer Churn Prediction:
- Predicts if a customer will stop using a service.
- Example: If a telecom company finds that customers who make fewer calls have a 70% chance of leaving, they offer discounts to retain them.
- Purchase Probability:
- Determines the likelihood of a customer buying a product.
- Example: An e-commerce company uses logistic regression to predict a 60% probability of a customer buying a phone based on browsing history.
4. Social Sciences & Survey Analysis
- Voting Behavior Prediction:
- Predicts election outcomes based on demographics.
- Example: If young voters have an 80% chance of supporting a particular candidate, campaign strategies are adjusted accordingly.
- Public Policy Analysis:
- Evaluates policy impacts on different groups.
- Example: If free education policies have an odds ratio of 2.0, it means students from low-income families are twice as likely to enroll in college.
5. Manufacturing & Quality Control
- Defect Detection:
- Predicts whether a product will have defects.
- Example: If a machine's vibration level increases, logistic regression may predict a 90% chance of defects, prompting preventive maintenance.
- Supply Chain Optimization:
- Helps assess supplier reliability.
- Example: If Supplier A has an odds ratio of 1.8 compared to Supplier B, it means Supplier A is 1.8 times more likely to deliver faulty parts.
Significance of Logistic Regression and Odds Ratio
1. Predictive Power & Decision Making
- Logistic regression helps predict categorical outcomes (e.g., will a customer churn? Will a patient develop a disease?).
- Odds ratio provides a clear interpretation of how much a factor increases or decreases the likelihood of an event.
- Example: In healthcare, predicting whether a patient has diabetes (Yes/No) based on age, BMI, and glucose levels helps doctors take preventive action.
2. Interpretability & Simplicity
- Unlike complex machine learning models, logistic regression is easy to understand and interpret.
- The odds ratio makes it simple to compare the impact of different variables.
- Example: If a study finds an odds ratio of 2.5 for smoking and lung cancer, it means smokers are 2.5 times more likely to develop lung cancer than non-smokers.
3. Risk Assessment & Classification
- Logistic regression is widely used in risk-based industries like banking, insurance, and healthcare.
- Example: Banks use it to classify loan applicants as low-risk or high-risk based on income, credit score, and past defaults.
4. Feature Importance & Variable Influence
- The coefficients in logistic regression show how much each variable contributes to the outcome.
- The odds ratio quantifies this impact, making it easier to interpret.
- Example: In customer retention analysis, if the odds ratio of "no recent purchases" is 3.0, customers who haven’t bought anything recently are 3 times more likely to leave.
5. Wide Applications Across Domains
- Healthcare: Disease prediction, treatment effectiveness.
- Finance: Credit scoring, fraud detection.
- Marketing: Customer churn, product purchase likelihood.
- Social Science: Voting behavior, policy impact assessment.
- Manufacturing: Defect prediction, supply chain reliability.
6. Foundation for Advanced Models
- Logistic regression serves as a building block for more complex models like neural networks and deep learning.
- It is computationally efficient, making it ideal for large datasets.
- Example: Fraud detection systems often start with logistic regression before integrating AI models.
Implementation in Python
import pandas as pd
import numpy as np
from sklearn.model_selection import train_test_split
from sklearn.linear_model import LogisticRegression
from sklearn.metrics import accuracy_score, confusion_matrix, classification_report
# Load dataset (Example: Breast Cancer dataset)
from sklearn.datasets import load_breast_cancer
data = load_breast_cancer()
df = pd.DataFrame(data.data, columns=data.feature_names)
df['target'] = data.target
# Splitting data
X = df.drop(columns=['target'])
y = df['target']
X_train, X_test, y_train, y_test = train_test_split(X, y, test_size=0.2, random_state=42)
# Train logistic regression model
model = LogisticRegression(max_iter=1000)
model.fit(X_train, y_train)
# Predictions
y_pred = model.predict(X_test)
# Evaluation
print("Accuracy:", accuracy_score(y_test, y_pred))
print("Confusion Matrix:\n", confusion_matrix(y_test, y_pred))
print("Classification Report:\n", classification_report(y_test, y_pred))
# Extracting odds ratio
odds_ratios = np.exp(model.coef_)
print("Odds Ratios:", odds_ratios)
Conclusion
Logistic regression and odds ratio are fundamental tools in statistical modeling and machine learning. While logistic regression is widely used for classification, the odds ratio provides an interpretable measure of the relationship between independent variables and the probability of an event occurring. With its vast applications in medicine, finance, and marketing, logistic regression remains a cornerstone of predictive analytics. Understanding its theoretical foundations and practical implementation can significantly enhance one’s ability to analyze and interpret data-driven insights.
Featured Blogs
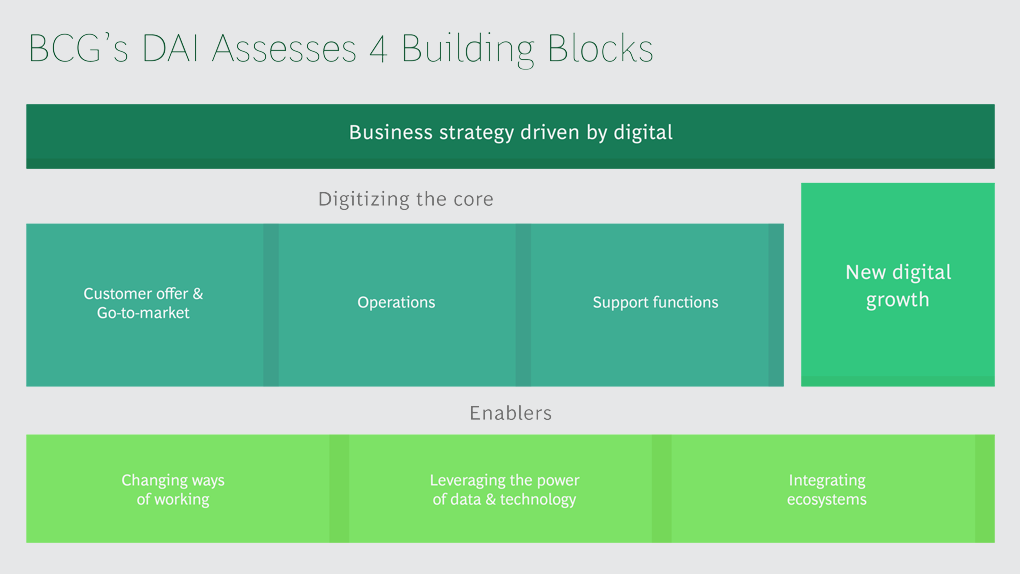
BCG Digital Acceleration Index
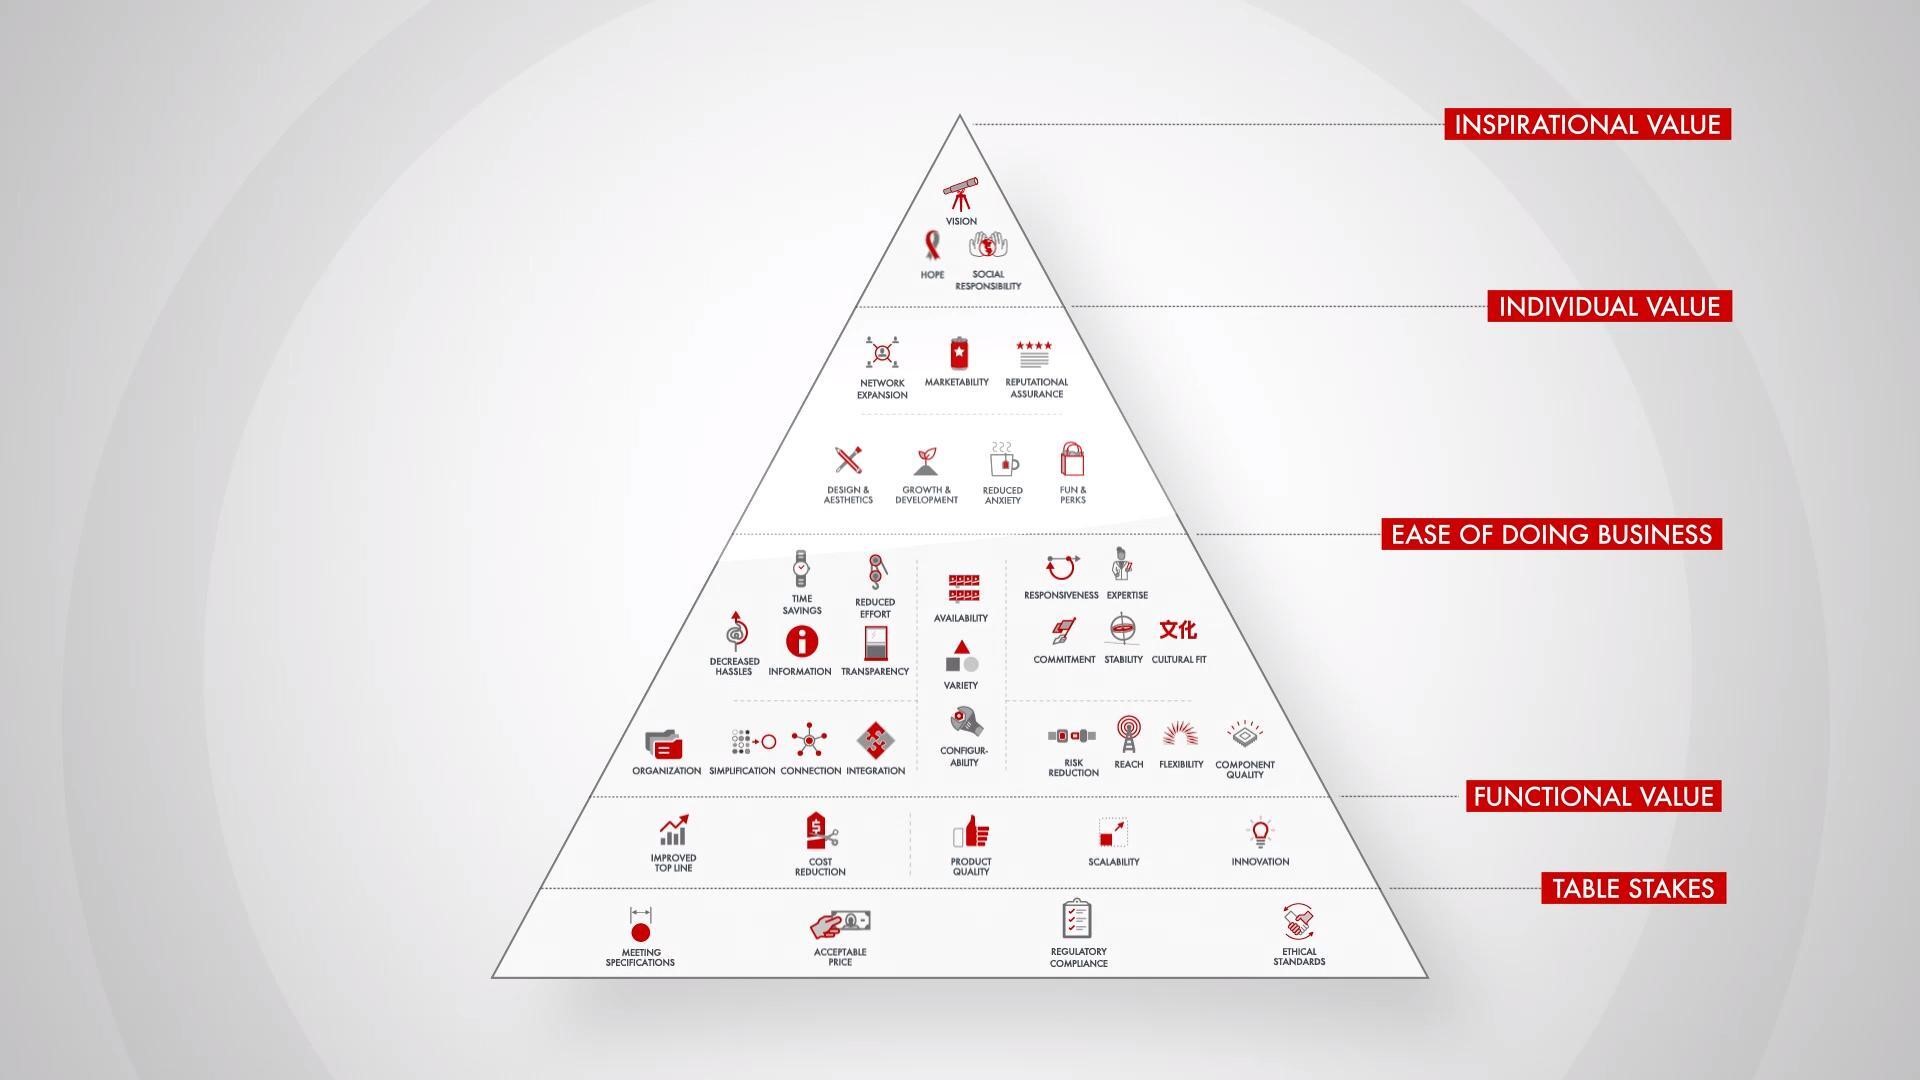
Bain’s Elements of Value Framework
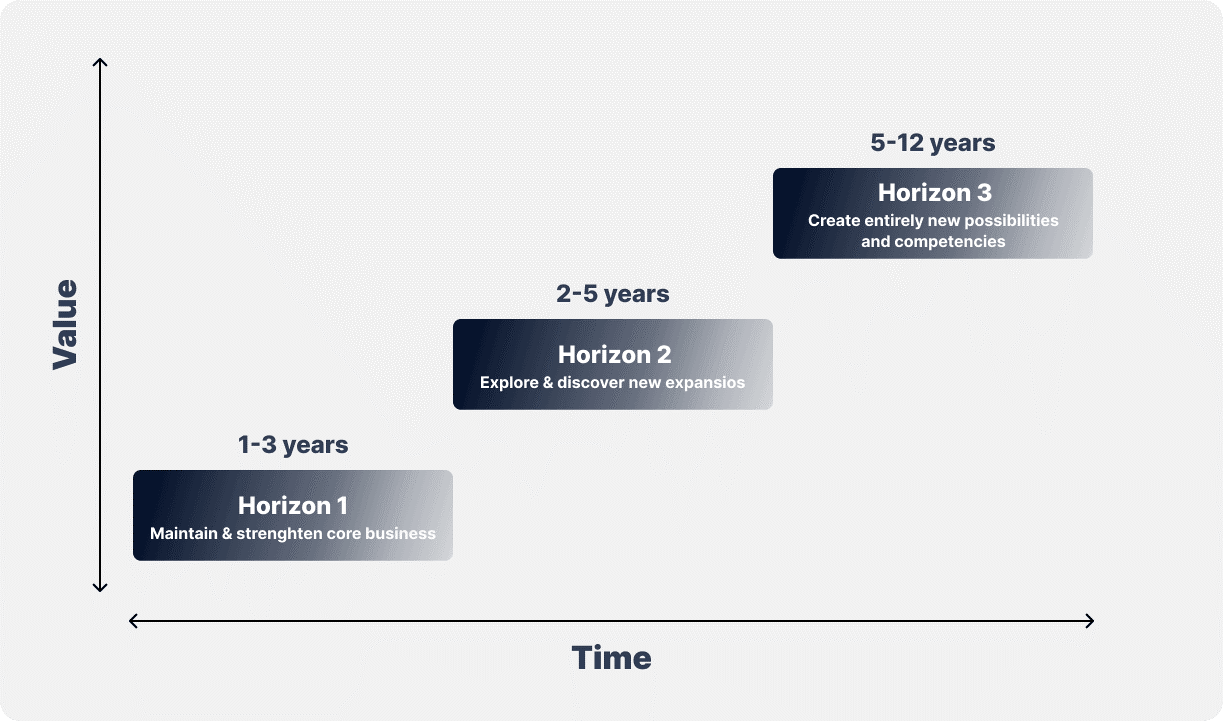
McKinsey Growth Pyramid
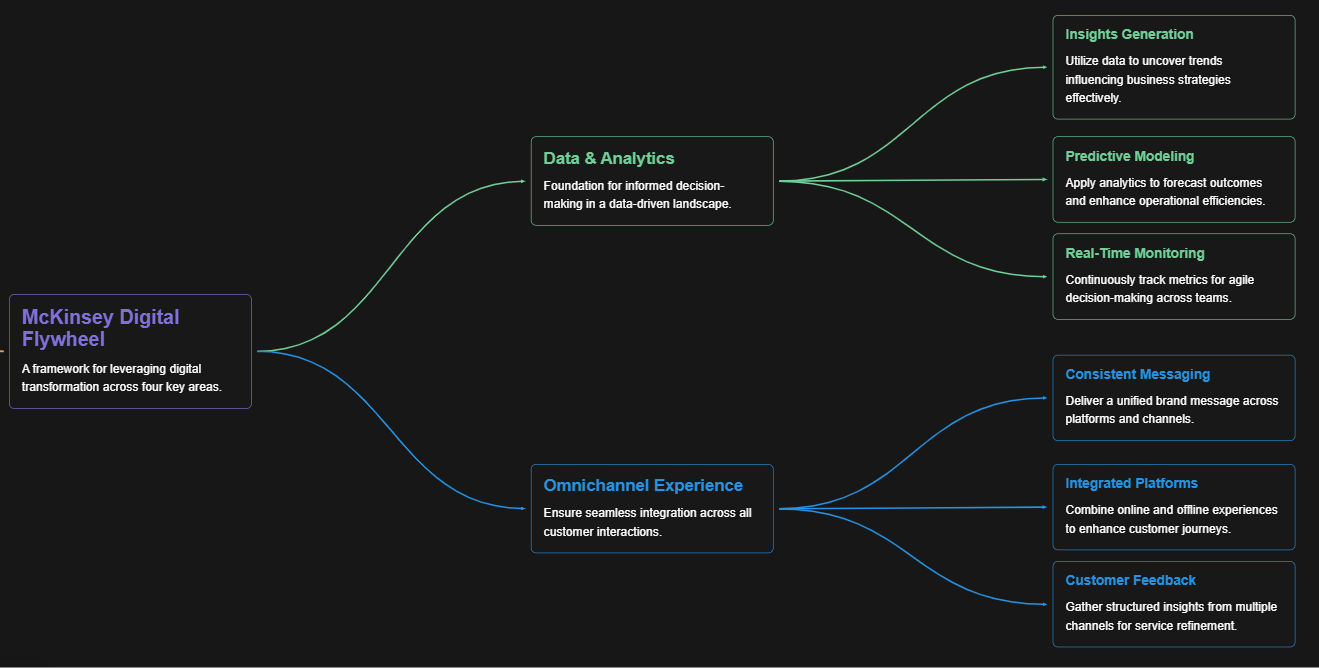
McKinsey Digital Flywheel
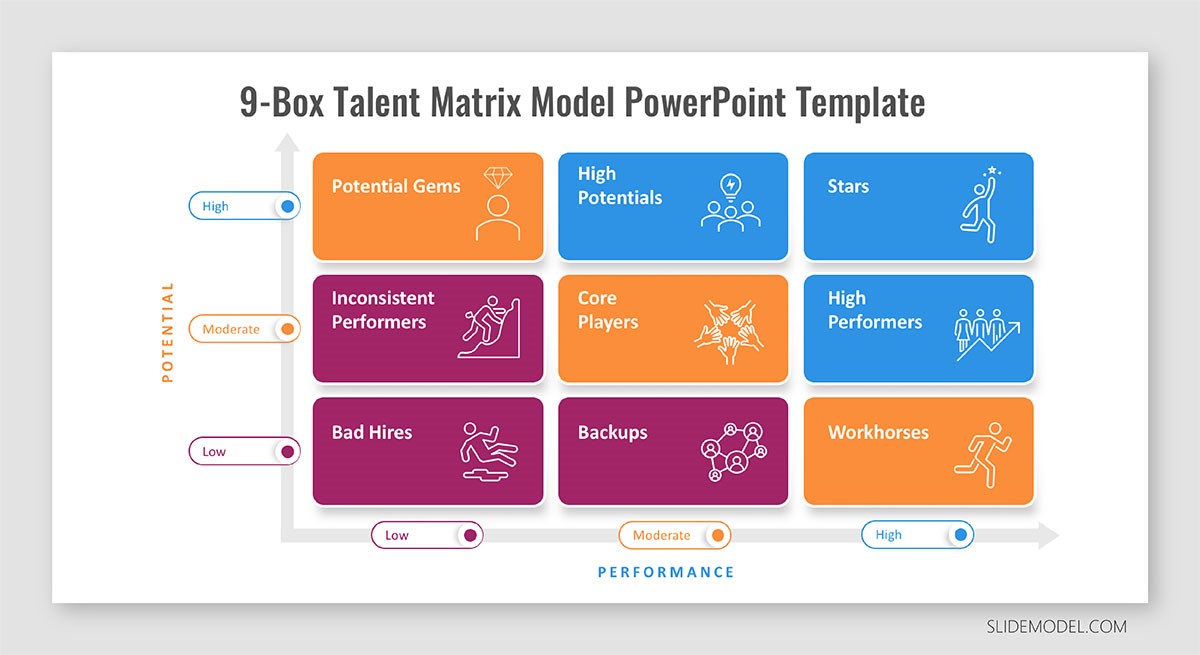
McKinsey 9-Box Talent Matrix

McKinsey 7S Framework
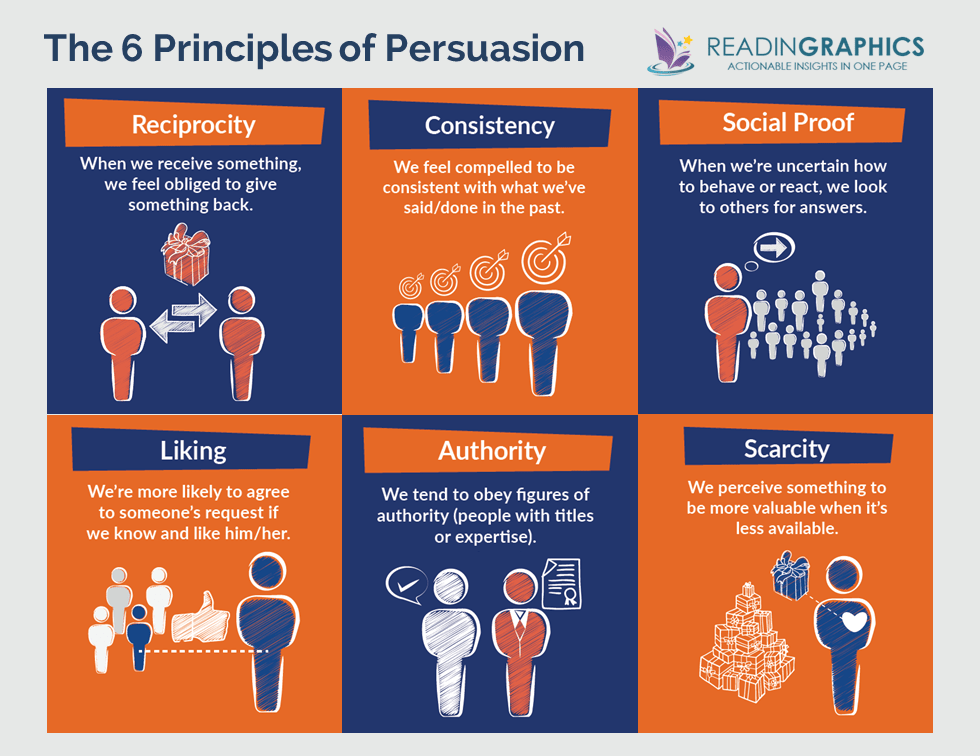
The Psychology of Persuasion in Marketing

The Influence of Colors on Branding and Marketing Psychology

What is Marketing?
Recent Blogs

Part 8: From Blocks to Brilliance – How Transformers Became Large Language Models (LLMs) of the series - From Sequences to Sentience: Building Blocks of the Transformer Revolution

Part 7: The Power of Now – Parallel Processing in Transformers of the series - From Sequences to Sentience: Building Blocks of the Transformer Revolution

Part 6: The Eyes of the Model – Self-Attention of the series - From Sequences to Sentience: Building Blocks of the Transformer Revolution

Part 5: The Generator – Transformer Decoders of the series - From Sequences to Sentience: Building Blocks of the Transformer Revolution

Part 4: The Comprehender – Transformer Encoders of the series - From Sequences to Sentience: Building Blocks of the Transformer Revolution of the series - From Sequences to Sentience: Building Blocks of the Transformer Revolution


