
Poisson Distribution
The Poisson distribution is a type of discrete probability distribution that represents the likelihood of a specific event occurring a given number of times (kkk) within a fixed time frame or spatial region.
This distribution is characterized by a single parameter, λ\lambdaλ (lambda), which denotes the average number of occurrences within the specified interval. The graph below illustrates different Poisson distributions for various values of λ\lambdaλ.

Table of Contents:
- Understanding Poisson Distribution
- Applications of Poisson Distribution
- Importance of Poisson Distribution
- Implementing Poisson Distribution in Python
- Conclusion
Understanding Poisson Distribution
The Poisson distribution is a discrete probability distribution that describes the likelihood of a countable event occurring within a fixed interval of time or space. The number of occurrences is represented by kkk.
This distribution is useful for estimating or analyzing the frequency of certain events within a specified timeframe or region. These events can range from customer purchases to natural phenomena like meteor strikes. The chosen interval could be any defined measure of time or space, such as 10 days or 5 square inches.
A Poisson distribution is appropriate when:
- Events occur randomly and independently, meaning the probability of one event does not influence another.
- The average number of occurrences within a given interval, denoted by λ\lambdaλ (lambda), is known and remains constant.
Since λ\lambdaλ determines the expected number of events, it is the key parameter required to calculate the probability of observing a specific number of occurrences.
Examples of Poisson Distribution in Real Life
The Poisson distribution can be used to model or predict various real-world scenarios, such as:
- Number of text messages received per hour
- Density of male grizzly bears per hectare
- Frequency of machine breakdowns in a year
- Monthly website traffic
- Yearly influenza cases in a population
Mean and Variance of Poisson Distribution
The Poisson distribution is characterized by a single parameter, λ\lambdaλ:
- The mean (expected value) of a Poisson distribution is λ\lambdaλ.
- The variance of a Poisson distribution is also λ\lambdaλ.
Poisson Distribution Formula
The probability mass function (PMF) of the Poisson distribution is given by:

where:
- k is the number of occurrences
- λ is the mean number of events in the given interval
- e is Euler’s number (approximately 2.718)
- k! represents the factorial of kkk
This formula calculates the probability of observing exactly kkk events within the specified interval when the events follow a Poisson distribution.
Example: Applying the Poisson Distribution Formula
In a study of Prussian army corps, it was observed that, on average, 0.61 soldiers per year died due to horse kicks. We aim to determine the probability that exactly two soldiers died in the VII Army Corps in 1898, assuming the number of such deaths follows a Poisson distribution.
Given data:
- k=2 (number of deaths)
- λ=0.61 (mean deaths per year)
- e≈2.718 (Euler’s constant)
Using the Poisson probability mass function (PMF):
P(X = k) = (λ^k * e^(-λ)) / k!
After performing the calculations, the probability of exactly two soldiers dying from horse kicks in the VII Army Corps in 1898 is 0.101.
Applications of Poisson Distribution
The Poisson distribution is widely utilized across various disciplines to model the probability of a specific number of events occurring within a fixed interval of time or space. It is particularly useful when events happen randomly and independently at a constant average rate. Below are some key applications:
1. Telecommunications and Networking
- Call Traffic: Used to predict the number of calls received in a call center within a given timeframe.
- Data Transmission: Helps model the arrival of data packets in network traffic, aiding in bandwidth management and optimization.
2. Healthcare and Epidemiology
- Disease Occurrence: Applied in epidemiology to estimate the number of new cases of a disease within a specific time period.
- Emergency Room Arrivals: Models patient inflow to emergency departments, assisting in hospital resource planning.
3. Quality Control in Manufacturing
- Defect Analysis: Used to estimate the number of defective products in a batch, assisting in maintaining quality standards.
4. Traffic and Queuing Systems
- Vehicle Flow: Predicts the number of vehicles arriving at a toll booth or intersection within a given period.
- Customer Service: Helps businesses estimate customer arrivals at service desks, optimizing staffing levels.
5. Insurance and Risk Management
- Claim Frequency: Insurance firms use Poisson models to assess the likelihood of claims occurring within a certain timeframe, aiding in policy pricing and risk evaluation.
Significance of Poisson Distribution
The Poisson distribution is important because of its ability to model rare events and occurrences over fixed intervals. Here’s why it is widely used:
1. Modeling Rare Events
It is well-suited for analyzing infrequent events, such as natural disasters, accidents, or system failures, helping in strategic planning and risk management.
2. Applicability in Time and Space Intervals
The Poisson distribution is useful for studying events occurring randomly and independently over fixed periods of time or space, making it applicable in numerous industries like healthcare, telecommunications, and transportation.
3. Independence of Events
One of its key assumptions is that each event occurs independently, making it effective in scenarios such as customer arrivals or failure rates, where one occurrence does not influence another.
4. Handling Discrete Data
Since the Poisson distribution models discrete occurrences, it is valuable for applications where data can only be counted in whole numbers, such as counting product defects or machine failures.
By providing a mathematical foundation for predicting event frequencies, the Poisson distribution remains an essential tool in probability theory, statistical modeling, and decision-making.
Implementation of Poisson Distribution in python
import numpy as np
import matplotlib.pyplot as plt
from scipy.stats import poisson

# Define the parameter (lambda, or average rate of occurrence)
lambda_rate = 4  # Average number of events in an interval

# Generate a range of values (k) for which we will calculate the probability
k_values = np.arange(0, 15)  # Values of k (number of events)

# Calculate the probability mass function (PMF) for each k
pmf_values = poisson.pmf(k_values, mu=lambda_rate)

# Plot the Poisson distribution
plt.bar(k_values, pmf_values, color='blue', alpha=0.7)
plt.title(f'Poisson Distribution (lambda = {lambda_rate})')
plt.xlabel('Number of events (k)')
plt.ylabel('Probability')
plt.grid(True)

## Explanation:
* Lambda (λ): This is the average number of events in a fixed interval (e.g., time, space). In this example, we set lambda_rate = 4.
* k_values: These are the discrete values for which we want to calculate the Poisson probabilities. In this case, we are considering values of
𝑘
k from 0 to 14.
* PMF: The poisson.pmf function computes the probability mass function, which gives us the probability of observing exactly
𝑘
k events when the average rate of occurrence is λ.
* Graph Explanation:
The bar chart represents the probability of different numbers of events (k) occurring based on a Poisson distribution with a given λ (lambda rate). The height of each bar corresponds to the probability of observing that number of events.
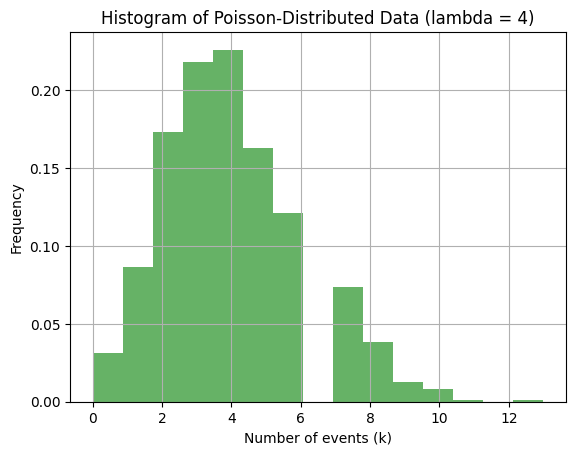
Simulating Poisson-Distributed Data:
# Simulate 1000 random variables from a Poisson distribution
poisson_data = poisson.rvs(mu=lambda_rate, size=1000)
# Plot histogram of the simulated data
plt.hist(poisson_data, bins=15, density=True, alpha=0.6, color='g')
plt.title(f'Histogram of Poisson-Distributed Data (lambda = {lambda_rate})')
plt.xlabel('Number of events (k)')
plt.ylabel('Frequency')
plt.grid(True)
plt.show()
Conclusion
The Poisson distribution is a powerful statistical tool for modeling the likelihood of discrete events occurring within a fixed time or space interval. Its widespread applications across various fields make it an essential distribution for statistical analysis. Below are the key takeaways:
- Effective for Rare and Random Events:
The Poisson distribution is particularly useful in situations where events occur infrequently and at random. It is commonly applied in scenarios where individual event probabilities are low, but there are numerous opportunities for occurrence, such as in accident rates or disease outbreaks. - Assumes a Constant Average Rate:
This distribution operates under the assumption that events happen at a steady average rate. This makes it suitable for applications like predicting customer arrivals at service centers or detecting defects in manufacturing processes, allowing organizations to optimize resource allocation and forecast demand efficiently. - Simplicity and Independence:
A key advantage of the Poisson distribution is its straightforward nature, along with the assumption that occurrences are independent of one another. This makes it a valuable tool for modeling processes where one event does not influence the likelihood of another. - Strong Predictive Capabilities:
By enabling the estimation of event occurrences over a defined period, the Poisson distribution aids in risk assessment, operational efficiency, and strategic decision-making. It is particularly beneficial in fields such as healthcare, transportation, and quality control.
Final Thoughts
The Poisson distribution provides a simple yet effective method for analyzing and predicting random, discrete events. It serves as a crucial tool for optimizing operations, managing uncertainties, and making informed decisions. However, users should carefully consider its assumptions and ensure it is appropriately applied to their specific data and context.
Featured Blogs

BCG Digital Acceleration Index

Bain’s Elements of Value Framework

McKinsey Growth Pyramid

McKinsey Digital Flywheel

McKinsey 9-Box Talent Matrix

McKinsey 7S Framework

The Psychology of Persuasion in Marketing

The Influence of Colors on Branding and Marketing Psychology

What is Marketing?
Recent Blogs

Part 8: From Blocks to Brilliance – How Transformers Became Large Language Models (LLMs) of the series - From Sequences to Sentience: Building Blocks of the Transformer Revolution

Part 7: The Power of Now – Parallel Processing in Transformers of the series - From Sequences to Sentience: Building Blocks of the Transformer Revolution

Part 6: The Eyes of the Model – Self-Attention of the series - From Sequences to Sentience: Building Blocks of the Transformer Revolution

Part 5: The Generator – Transformer Decoders of the series - From Sequences to Sentience: Building Blocks of the Transformer Revolution

Part 4: The Comprehender – Transformer Encoders of the series - From Sequences to Sentience: Building Blocks of the Transformer Revolution of the series - From Sequences to Sentience: Building Blocks of the Transformer Revolution
