
F-Test and ANOVA
Statistical hypothesis testing plays a crucial role in data analysis, decision-making, and scientific research. The F-Test and Analysis of Variance (ANOVA) are two fundamental statistical methods that allow researchers to analyze and compare data from different groups effectively.
- The F-Test is a statistical method used to compare the variances of two populations to determine if they are significantly different.
- ANOVA extends this idea and helps compare the means of three or more groups to identify statistically significant differences.
Both methods are widely used in experimental studies, business analytics, quality control, healthcare, and various other fields.
Table of Contents
Understanding the F-Test
Definition and Concept
Importance of the F-Test
Assumptions of the F-Test
Step-by-Step Process of Performing an F-Test
Types of F-Tests
Analysis of Variance (ANOVA)
Concept of ANOVA
Why Use ANOVA Instead of Multiple t-Tests?
Types of ANOVA
Assumptions of ANOVA
Step-by-Step Process of Performing ANOVA
Applications of F-Test and ANOVA
Significance of F-Test and ANOVA
Implementation in Python
F-Test for Equality of Variances
One-Way ANOVA
Conclusion
Understanding the F-Test
Definition and Concept
The F-Test is a statistical test that uses the F-distribution to compare the variances of two datasets. It is commonly used in:
- Comparing the variances of two samples to determine if they are significantly different.
- Testing the overall significance of a regression model.
- Evaluating the homogeneity of variances before conducting ANOVA.
Importance of the F-Test
Understanding variance is essential because it helps determine the consistency and reliability of a dataset. If two datasets have significantly different variances, statistical comparisons like t-tests and ANOVA may not be valid without adjustments.
Assumptions of the F-Test
To perform an F-Test correctly, certain assumptions must be met:
- Normality: The data in each sample must be normally distributed.
- Independence: The samples must be drawn independently from their respective populations.
- Continuous Data: The data should be measured on a continuous scale (e.g., height, weight, temperature).
Step-by-Step Process of Performing an F-Test
- Formulate the Hypotheses:
- Null Hypothesis (H₀): The variances of both samples are equal.
- Alternative Hypothesis (H₁): The variances are not equal.
- Compute the F-Statistic: F =

- Compare with the Critical Value:
- If F > F-critical, reject the null hypothesis.
- If p-value < 0.05, reject the null hypothesis.
Types of F-Tests
- F-Test for Equality of Variances: Compares the variances of two groups.
- F-Test in ANOVA: Used to determine if the means of multiple groups differ significantly.
- F-Test in Regression Analysis: Assesses the overall significance of a regression model.
Analysis of Variance (ANOVA)
Concept of ANOVA
The Analysis of Variance (ANOVA) is a statistical method used to compare the means of three or more groups. Unlike the t-test, which is limited to two groups, ANOVA allows researchers to test multiple groups simultaneously, reducing the risk of Type I errors.
Why Use ANOVA Instead of Multiple t-Tests?
If we compare multiple groups using individual t-tests, the probability of making a false positive (Type I error) increases. ANOVA solves this issue by testing all groups in one analysis.
Types of ANOVA
- One-Way ANOVA: Compares means across a single independent variable.
- Two-Way ANOVA: Compares means across two independent variables.
- Repeated Measures ANOVA: Used when the same subjects are tested multiple times.
Assumptions of ANOVA
- Normality: The dependent variable should be normally distributed.
- Equal Variance: The groups should have similar variances.
- Independence: Observations should be independent of each other.
Step-by-Step Process of Performing ANOVA
- Formulate Hypotheses:
- H₀: All group means are equal.
- H₁: At least one group mean is different.
- Calculate the F-Statistic: : F =
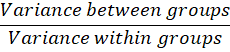
- Compare with Critical Value or p-Value:
- If F > F-critical or p-value < 0.05, reject H₀.
Applications of F-Test and ANOVA
1. Medical and Pharmaceutical Research
- Clinical Trials: Used to compare the effectiveness of different treatments or drugs across multiple patient groups.
- Biological Variability: Helps analyze differences in medical test results across different demographics.
Example: Testing whether three different blood pressure medications have significantly different effects on patients.
2. Economics and Market Research
- Policy Evaluation: ANOVA is used to compare the impact of different economic policies on GDP, inflation, or employment rates.
- Consumer Behavior Analysis: Helps compare customer preferences for multiple products or marketing strategies.
Example: Analyzing whether different advertising campaigns lead to significantly different sales figures.
3. Manufacturing and Quality Control
- Process Improvement: F-Test helps determine if variations in production batches are due to random noise or real differences in quality.
- Defect Analysis: ANOVA is used to compare defect rates across different manufacturing processes or raw materials.
Example: Testing whether different types of raw materials affect the durability of a product.
4. Education and Academic Performance Analysis
- Teaching Methods Comparison: ANOVA is used to analyze whether different teaching styles lead to different student performance levels.
- Standardized Testing: Helps compare student test scores across different schools or regions.
Example: Evaluating whether students in different classrooms score significantly differently on a standardized math test.
5. Business and Human Resource Analytics
- Salary Disparities: ANOVA is used to compare salaries across different departments, experience levels, or geographic locations.
- Employee Performance Evaluation: Helps analyze differences in productivity among employees trained under different programs.
Example: Determining if sales team performance varies significantly based on different training programs.
6. Agriculture and Environmental Studies
- Crop Yield Comparison: ANOVA helps analyze whether different fertilizers or farming techniques produce significantly different crop yields.
- Environmental Impact Studies: F-Test and ANOVA can compare pollution levels across different industrial areas.
Example: Testing whether different irrigation methods lead to significant differences in crop yields.
7. Engineering and Product Testing
- Material Strength Testing: F-Test is used to compare variances in the strength of different materials under stress tests.
- Software Performance Analysis: ANOVA helps compare the efficiency of different software versions or algorithms.
Example: Testing whether different fuel types lead to significant differences in vehicle mileage.
8. Social Sciences and Psychology
- Behavioral Studies: ANOVA is used to compare responses in psychological experiments across multiple groups.
- Surveys and Opinion Polls: Helps determine if opinions vary significantly among different demographics.
Example: Analyzing whether stress levels differ significantly among students in different academic programs.
Significance of F-Test and ANOVA
The F-Test and Analysis of Variance (ANOVA) are fundamental statistical tools that help determine whether observed differences between groups are statistically significant or merely due to random variation. Their significance extends across various fields, ensuring data-driven decision-making and scientific accuracy.
1. Determines Statistical Significance
- Both F-Test and ANOVA assess whether differences between groups are statistically meaningful rather than occurring by chance.
- The p-value from the F-Test/ANOVA helps in deciding whether to reject the null hypothesis.
Example: In a medical trial, if a new drug’s effectiveness significantly differs among three groups, ANOVA helps confirm if the difference is real.
2. Compares Multiple Groups Efficiently
- Unlike t-tests, which can only compare two groups at a time, ANOVA allows comparison of three or more groups simultaneously.
- This reduces errors and avoids multiple testing problems.
Example: Instead of running multiple t-tests to compare five different fertilizers, ANOVA can analyze them in a single test, reducing the risk of Type I errors.
3. Measures Variability and Consistency
- The F-Test is used to compare variances between two datasets, helping assess data consistency and quality control.
- In ANOVA, the total variation is divided into between-group variance and within-group variance, helping understand the true impact of categorical factors.
Example: A manufacturer uses an F-Test to check whether the variance in car engine performance is similar across different batches.
4. Crucial in Experimental Research
- ANOVA is widely used in controlled experiments to test the impact of independent variables on a dependent variable.
- It ensures that observed differences are due to experimental conditions rather than random fluctuations.
Example: A psychologist tests whether three different therapy methods lead to different levels of patient improvement.
5. Enhances Business and Economic Decision-Making
- ANOVA helps businesses analyze customer behavior, marketing strategies, and product performance.
- F-Test in economics helps determine the significance of factors affecting GDP growth, inflation, and sales trends.
Example: A company evaluates whether different marketing campaigns significantly impact product sales.
6. Supports Machine Learning and Data Science
- ANOVA is used in feature selection to determine which categorical variables significantly impact the target variable.
- The F-Test is used in regression analysis to compare different models and identify the best predictors.
Example: In a customer churn prediction model, ANOVA helps determine if customer age significantly impacts churn rates.
7. Ensures Fairness in Salary and Performance Analysis
- ANOVA is used to analyze salary disparities across different groups to check for bias or discrimination.
- The F-Test is useful for comparing performance evaluations across departments.
Example: HR departments use ANOVA to check if employee salaries vary significantly based on gender, job roles, or experience.
8. Widely Used in Quality Control and Manufacturing
- F-Test helps compare variances in machine output to ensure uniform product quality.
- ANOVA tests whether different manufacturing processes produce significantly different defect rates.
Example: A company tests whether three different production methods yield significantly different defect rates.
Implementation in Python
F-Test for Equality of Variances
import scipy.stats as stats
group1 = [20, 21, 19, 18, 22, 25, 20]
group2 = [30, 29, 31, 35, 28, 30, 33]
f_statistic, p_value = stats.f_oneway(group1, group2)
print("F-Statistic:", f_statistic)
print("P-Value:", p_value)
One-Way ANOVA
import pandas as pd
import statsmodels.api as sm
from statsmodels.formula.api import ols
data = pd.DataFrame({
'Score': [85, 90, 88, 92, 75, 78, 80, 83, 95, 97, 96, 99],
'Group': ['A', 'A', 'A', 'A', 'B', 'B', 'B', 'B', 'C', 'C', 'C', 'C']
})
model = ols('Score ~ Group', data=data).fit()
anova_table = sm.stats.anova_lm(model, typ=2)
print(anova_table)
Conclusion
The F-Test and ANOVA are essential statistical tools for comparing variances and means across groups. They help determine whether observed differences are significant or due to chance, making them crucial in research, business, and data analysis. With easy implementation in Python, these tests provide valuable insights, but it's important to check their assumptions for accurate results. Understanding and applying these techniques effectively can enhance decision-making and data-driven strategies.
Featured Blogs

BCG Digital Acceleration Index

Bain’s Elements of Value Framework

McKinsey Growth Pyramid

McKinsey Digital Flywheel

McKinsey 9-Box Talent Matrix

McKinsey 7S Framework

The Psychology of Persuasion in Marketing

The Influence of Colors on Branding and Marketing Psychology

What is Marketing?
Recent Blogs

Part 8: From Blocks to Brilliance – How Transformers Became Large Language Models (LLMs) of the series - From Sequences to Sentience: Building Blocks of the Transformer Revolution

Part 7: The Power of Now – Parallel Processing in Transformers of the series - From Sequences to Sentience: Building Blocks of the Transformer Revolution

Part 6: The Eyes of the Model – Self-Attention of the series - From Sequences to Sentience: Building Blocks of the Transformer Revolution

Part 5: The Generator – Transformer Decoders of the series - From Sequences to Sentience: Building Blocks of the Transformer Revolution

Part 4: The Comprehender – Transformer Encoders of the series - From Sequences to Sentience: Building Blocks of the Transformer Revolution of the series - From Sequences to Sentience: Building Blocks of the Transformer Revolution
