Causal Inference and A/B Testing
In today's data-driven world, businesses and researchers are increasingly focused on making informed decisions based on empirical evidence. Two fundamental statistical approaches that facilitate decision-making are Causal Inference and A/B Testing. Causal inference focuses on understanding the causal relationships between variables, meaning it aims to establish that changes in one variable directly cause changes in another, rather than merely showing a correlation. In contrast, A/B testing, also known as split testing or bucket testing, is a method for comparing two versions of a webpage, email, or other online content to determine which one performs better based on specific metrics. While causal inference aims to determine if and how one variable influences another, A/B testing is designed to compare the performance of two variations of a product, such as website pages, to identify the more effective option.
Table of Contents
- Understanding Causal Inference
- Definition and Principles
- Correlation vs Causation
- Methods of Causal Inference
2. Understanding A/B Testing
- Definition and Purpose
- Key Metrics in A/B Testing
- Experimental Design
3. Applications of Causal Inference and A/B Testing
4. Significance in Decision-Making
5. Implementation in Python
6. Conclusion
Understanding Causal Inference
Definition and Principles
Causal inference refers to the process of determining whether one variable directly affects another. Unlike correlation, which only identifies associations, causal inference seeks to establish a cause-and-effect relationship.
Key principles of causal inference include:
- Counterfactual Thinking: Comparing what happened with what could have happened under different conditions.
- Randomization: Eliminating confounding factors by randomly assigning subjects to treatment and control groups.
- Observational Studies: Using statistical techniques to infer causation from non-experimental data.
Correlation vs Causation
A common misconception is that correlation implies causation. However, correlation simply means two variables move together, while causation establishes a direct effect.
For example:
- Correlation: Ice cream sales and drowning incidents increase in summer, but one does not cause the other.
- Causation: Smoking leads to lung cancer.
Methods of Causal Inference
Several techniques help establish causal relationships:
- Randomized Controlled Trials (RCTs): The gold standard for causal inference, where subjects are randomly assigned to treatment and control groups.
- Difference-in-Differences (DiD): Compares the difference in outcomes before and after an intervention across two groups.
- Instrumental Variables (IV): Uses an external variable (instrument) to determine causality.
- Propensity Score Matching (PSM): Matches treated and untreated subjects based on similar characteristics.
Understanding A/B Testing
Definition and Purpose
A/B testing, also known as split testing, is an experimental method used to compare two versions (A and B) of a product, webpage, or marketing strategy to determine which one performs better.
Key Metrics in A/B Testing
Key performance indicators (KPIs) vary based on the domain but often include:
- Conversion Rate: Percentage of users taking the desired action.
- Click-Through Rate (CTR): Percentage of users clicking a link or button.
- Bounce Rate: Percentage of users leaving a page without interaction.
- Revenue per User: Amount of revenue generated per visitor.
Experimental Design
A well-structured A/B test follows these steps:
- Define Hypothesis: Identify the goal (e.g., increasing sign-ups).
- Split the Audience: Randomly assign users to groups (A = control, B = variation).
- Run the Experiment: Expose users to different versions.
- Analyze the Results: Use statistical significance tests (e.g., t-tests, chi-square tests) to evaluate outcomes.
- Make Data-Driven Decisions: Implement the better-performing version.
Applications of Causal Inference and A/B Testing
Marketing & E-commerce
- Determining whether a new pricing strategy increases sales.
- Testing different email marketing campaigns to improve engagement.
Healthcare
- Evaluating the effectiveness of a new drug or treatment method.
- Understanding the impact of lifestyle changes on disease prevention.
Finance & Banking
- Assessing the impact of credit score changes on loan default rates.
- Testing new app features to increase user retention.
Public Policy & Social Sciences
- Analyzing the effect of educational programs on student performance.
- Studying the impact of government subsidies on economic growth.
Significance in Decision-Making
Both causal inference and A/B testing play a crucial role in making data-driven decisions. Their significance includes:
- Reducing Uncertainty: Helps businesses and researchers avoid guesswork.
- Improving Efficiency: Optimizes marketing campaigns, healthcare treatments, and product development.
- Enhancing Customer Experience: Ensures that implemented changes genuinely improve user satisfaction.
- Driving Profitability: Identifies the most effective strategies for revenue growth.
Implementation in Python
A/B Testing in Python
import numpy as np
import pandas as pd
from scipy.stats import ttest_ind
# Sample data: Conversion rates of two groups
np.random.seed(42)
group_A = np.random.binomial(1, 0.10, 1000) # 10% conversion rate
group_B = np.random.binomial(1, 0.12, 1000) # 12% conversion rate
# T-test to compare means
stat, p_value = ttest_ind(group_A, group_B)
print(f'T-statistic: {stat}, P-value: {p_value}')
# Interpretation
if p_value < 0.05:
print('Statistically significant difference! Implement version B.')
else:
print('No significant difference. Keep version A.')
Causal Inference in Python
import numpy as np
import pandas as pd
from sklearn.linear_model import LogisticRegression
# Simulating Data
np.random.seed(42)
n = 500 # Smaller dataset for simplicity
data = pd.DataFrame({
'treatment': np.random.choice([0, 1], size=n), # 0 = No treatment, 1 = Treatment
'age': np.random.randint(18, 60, n),
'income': np.random.randint(30000, 100000, n),
'outcome': np.random.choice([0, 1], size=n) # 0 = No effect, 1 = Positive effect
})

# Step 1: Compute Propensity Scores (Probability of receiving treatment)
X = data[['age', 'income']]
y = data['treatment']
model = LogisticRegression()
model.fit(X, y)
data['propensity_score'] = model.predict_proba(X)[:, 1] # Probability of being in treatment group

# Step 2: Matching (Sorting by Propensity Score)
data = data.sort_values(by='propensity_score')
# Step 3: Calculate Treatment Effect
treated = data[data['treatment'] == 1]['outcome'].mean()
control = data[data['treatment'] == 0]['outcome'].mean()
treatment_effect = treated - control
# Output
print(f'Average Outcome (Treated Group): {treated: .2f}')
print(f'Average Outcome (Control Group): {control: .2f}')
print(f'Estimated Treatment Effect: {treatment_effect: .2f}')
Conclusion
Causal inference and A/B testing are powerful tools for making evidence-based decisions. By understanding causal relationships and running controlled experiments, businesses, healthcare providers, and policymakers can optimize strategies and improve outcomes. With Python, implementing these methods becomes accessible, enabling data-driven decision-making across various industries. By leveraging these techniques effectively, organizations can reduce uncertainty, enhance customer satisfaction, and drive sustainable growth in an increasingly competitive landscape.
Featured Blogs
BCG Digital Acceleration Index
Bain’s Elements of Value Framework
McKinsey Growth Pyramid
McKinsey Digital Flywheel
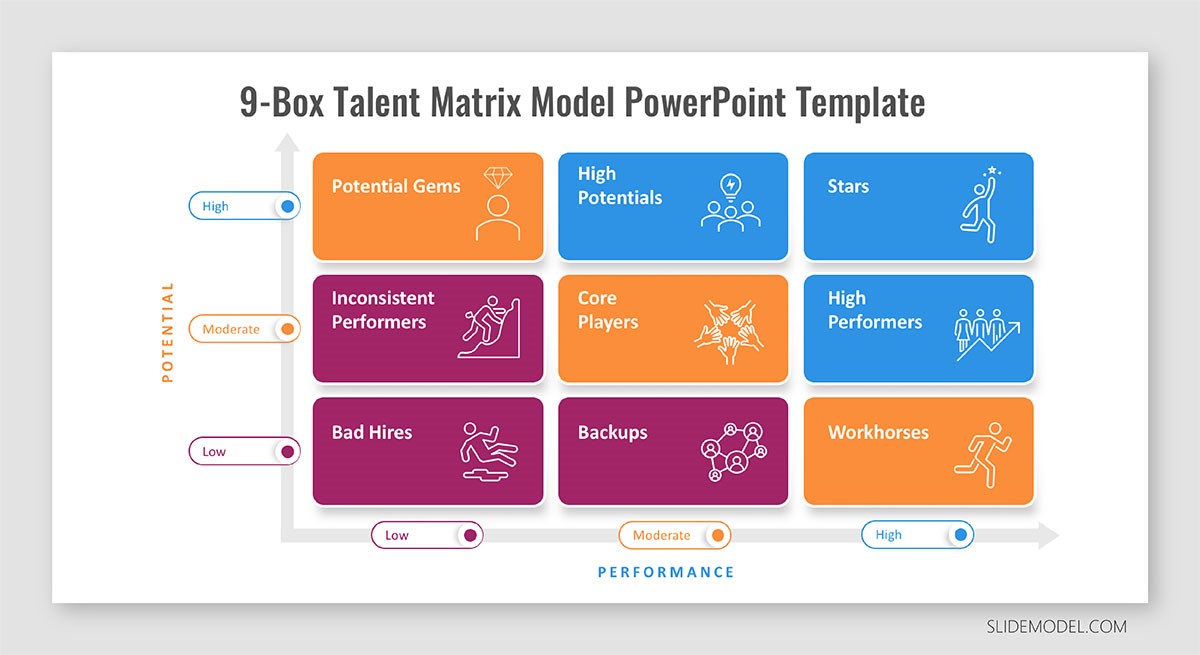
McKinsey 9-Box Talent Matrix
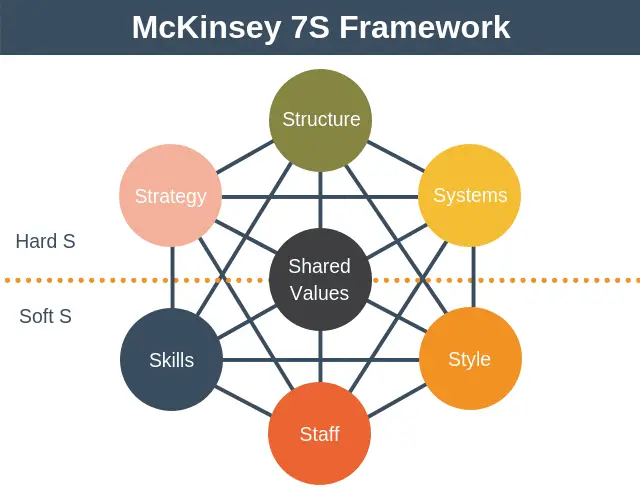
McKinsey 7S Framework
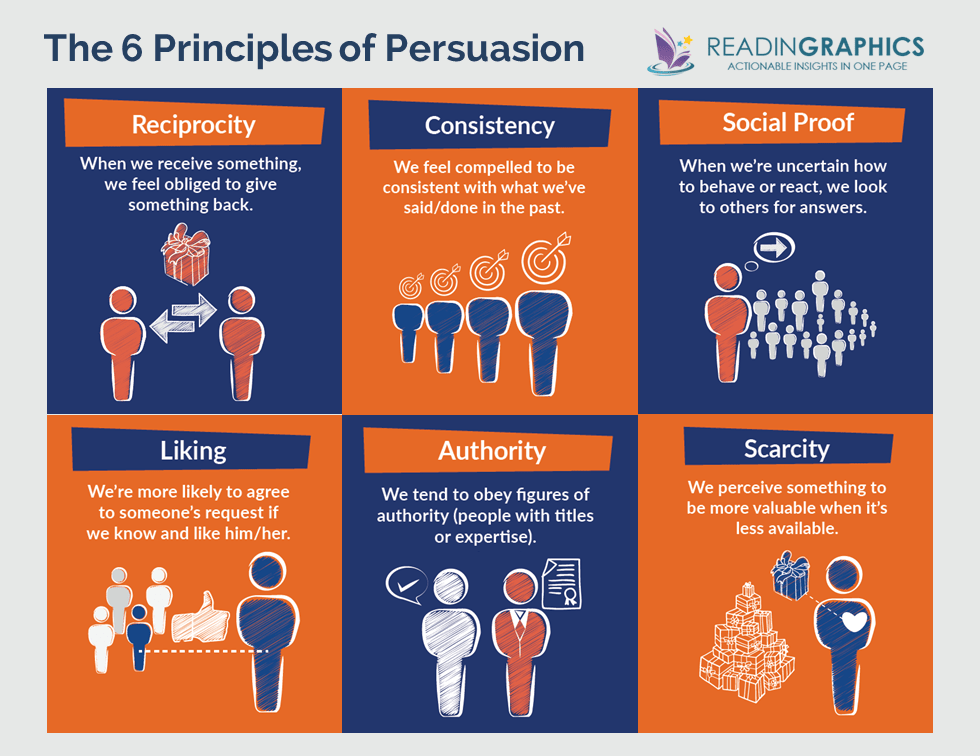
The Psychology of Persuasion in Marketing

The Influence of Colors on Branding and Marketing Psychology

What is Marketing?
Recent Blogs

Part 8: From Blocks to Brilliance – How Transformers Became Large Language Models (LLMs) of the series - From Sequences to Sentience: Building Blocks of the Transformer Revolution

Part 7: The Power of Now – Parallel Processing in Transformers of the series - From Sequences to Sentience: Building Blocks of the Transformer Revolution
Part 6: The Eyes of the Model – Self-Attention of the series - From Sequences to Sentience: Building Blocks of the Transformer Revolution

Part 5: The Generator – Transformer Decoders of the series - From Sequences to Sentience: Building Blocks of the Transformer Revolution

Part 4: The Comprehender – Transformer Encoders of the series - From Sequences to Sentience: Building Blocks of the Transformer Revolution of the series - From Sequences to Sentience: Building Blocks of the Transformer Revolution


