Media vs. Non-Media Budget Allocation
Dan was sitting across from Sarah, the newly appointed CMO, at a bustling coffee shop just outside the financial district. She stirred her latte pensively before looking up. "You know what's keeping me awake at night? Our budget allocation. We're pouring millions into media, but I'm questioning if that's where all our money should go." She explained that while their digital ads were generating clicks, their overall brand health metrics had plateaued. "I need to fundamentally rethink our media versus non-media investment," she admitted. That conversation sparked Dan's deep dive into one of marketing's most consequential decisions—how to balance the dollars that drive visibility against those that build capability and create experiences.
Introduction: The Budgetary Balancing Act
Marketing budgeting has evolved from a straightforward media placement exercise into a complex strategic allocation process across an expanding ecosystem of options. The fundamental division between media and non-media spending represents perhaps the most critical high-level budgetary decision facing modern marketers. Research from the Marketing Leadership Council indicates that companies that optimize this balance outperform those with imbalanced approaches by 27% in terms of marketing-attributed revenue growth.
The media versus non-media allocation decision fundamentally shapes an organization's marketing approach, determining whether it emphasizes reach and frequency or experience and engagement. As marketing environments grow increasingly fragmented, this allocation decision has only grown in strategic importance, with profound implications for both short-term results and long-term brand building.
1. Definitions and Categories
Media spending encompasses all investments in purchased visibility, including:
Paid Media Categories:
- Traditional broadcast (television, radio)
- Print advertising (newspapers, magazines)
- Out-of-home placements (billboards, transit)
- Digital display and search
- Social media advertising
- Programmatic platforms
- Streaming audio and video placements
Non-media spending includes all marketing investments not directly tied to media placement:
Non-Media Categories:
- Content creation and production
- Website and app development
- Customer experience initiatives
- Marketing technology stack
- Agency and creative services
- Consumer research and insights
- Events and experiential marketing
- Public relations and communications
The Marketing Leadership Council's research indicates most enterprise companies allocate between 50-70% to media spending and 30-50% to non-media investments, though these proportions vary significantly by industry. Technology firms typically skew heavily toward non-media (often allocating 60% or more), while consumer packaged goods companies traditionally favor media-heavy allocations (sometimes exceeding 80% of budgets).
2. Value Drivers in Each Category
Media and non-media investments contribute differently to marketing success, each with distinct value creation mechanisms.
Media Value Drivers:
- Scale and reach capabilities
- Frequency building for awareness
- Cost efficiency in contact delivery
- Targeting precision for relevance
- Measurable performance metrics
- Real-time optimization potential
Example: Procter & Gamble's 2023 strategic shift illustrates media's value proposition. By reallocating $300 million from digital performance to addressable TV and streaming, they recorded a 7% increase in unaided awareness across their portfolio brands while maintaining conversion rates.
Non-Media Value Drivers:
- Experience quality and consistency
- Content depth and engagement
- Data capture and utilization capabilities
- Infrastructure building for long-term advantage
- Talent development and organizational capabilities
- Innovation capacity and speed to market
Example: Mastercard's "Priceless" experiential platform demonstrates non-media value creation. Their shift from 80% media spending to a 60/40 media/non-media split enabled the creation of Priceless.com, which now delivers experiences to over 4 million cardholders annually, driving 31% higher retention rates among participants.
The interconnected nature of these investments often makes value attribution challenging. Research from Marketing Evolution suggests that non-media investments act as "multipliers" for media effectiveness, with companies achieving integrated approaches seeing 2.2x higher return on media investments compared to those with disconnected strategies.
3. Shifting Trends in Budget Allocation
Several significant trends are reshaping the media/non-media allocation landscape:
Content Investment Acceleration The content creation share of marketing budgets has increased from 13% to 25% over the past decade according to Marketing Leadership Council data, driven by:
- Channel proliferation requiring tailored assets
- Personalization demands increasing content production needs
- First-party content strategies building owned audiences
- Video dominance requiring higher production values
Technology Infrastructure Growth MarTech and data infrastructure now represent the fastest-growing non-media budget category, averaging 26% of non-media spending:
- Customer data platforms centralizing audience intelligence
- Marketing automation enabling scaled personalization
- Analytics capabilities driving optimization
- Privacy-enhancing technologies addressing regulatory challenges
Hybrid Investment Categories Traditional boundaries between media and non-media are blurring:
- Retail media networks combine media placement with trade marketing
- Influencer investments merge media reach with content creation
- Native advertising blends media placement with content development
- Partner integrations combine brand presence with experience delivery
Conclusion: The Strategic Imperative
The media versus non-media allocation decision has evolved from a tactical media planning exercise into a strategic choice that reflects fundamental marketing philosophy. The most successful organizations approach this allocation as a dynamic, continuously optimized balance rather than a fixed formula.
As marketing increasingly focuses on delivering integrated experiences across the customer journey, the most effective budget approaches maintain sufficient flexibility to respond to changing consumer behaviors, competitive actions, and performance indicators while maintaining consistent investment in both visibility-driving media and experience-building non-media categories.
The organizations demonstrating superior marketing performance increasingly adopt what the Marketing Leadership Council terms "capability-based budgeting"—allocating resources based on the capabilities required to deliver competitive advantage rather than rigid media/non-media formulas.
Call to Action
For marketing leaders seeking to optimize their media and non-media allocations:
- Conduct capability gap analysis to identify non-media investment priorities
- Develop integrated measurement frameworks capturing both media and non-media contributions
- Implement quarterly reallocation processes based on performance indicators
- Create cross-functional budget governance involving technology, experience, and media teams
- Establish ROI benchmarks for all major investment categories
- Build scenario planning approaches for rapidly shifting allocations based on market conditions
The future belongs to organizations that view the media/non-media division not as competing interests but as complementary investments in an integrated marketing system—each amplifying the other's effectiveness when strategically balanced.
Featured Blogs
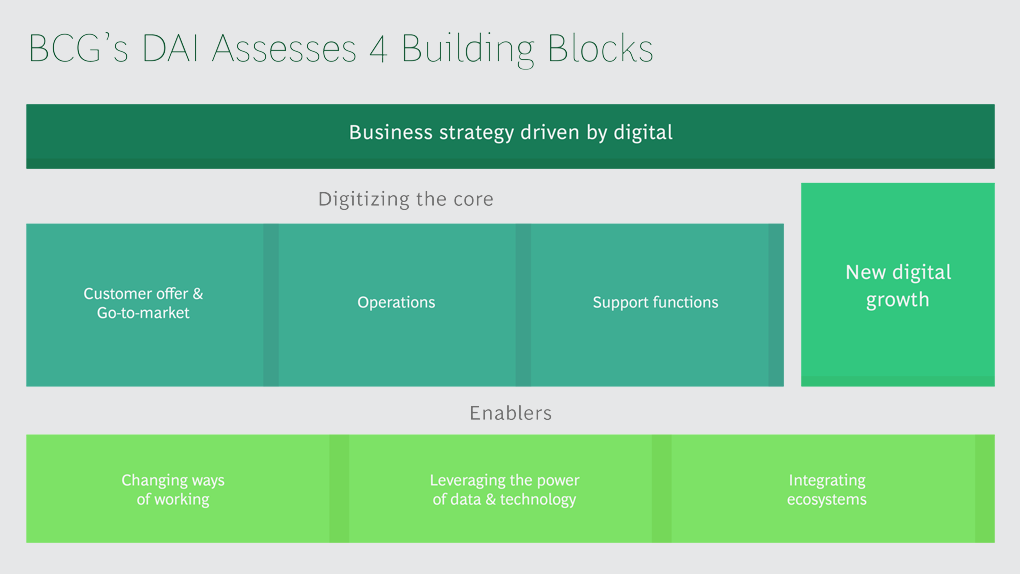
BCG Digital Acceleration Index
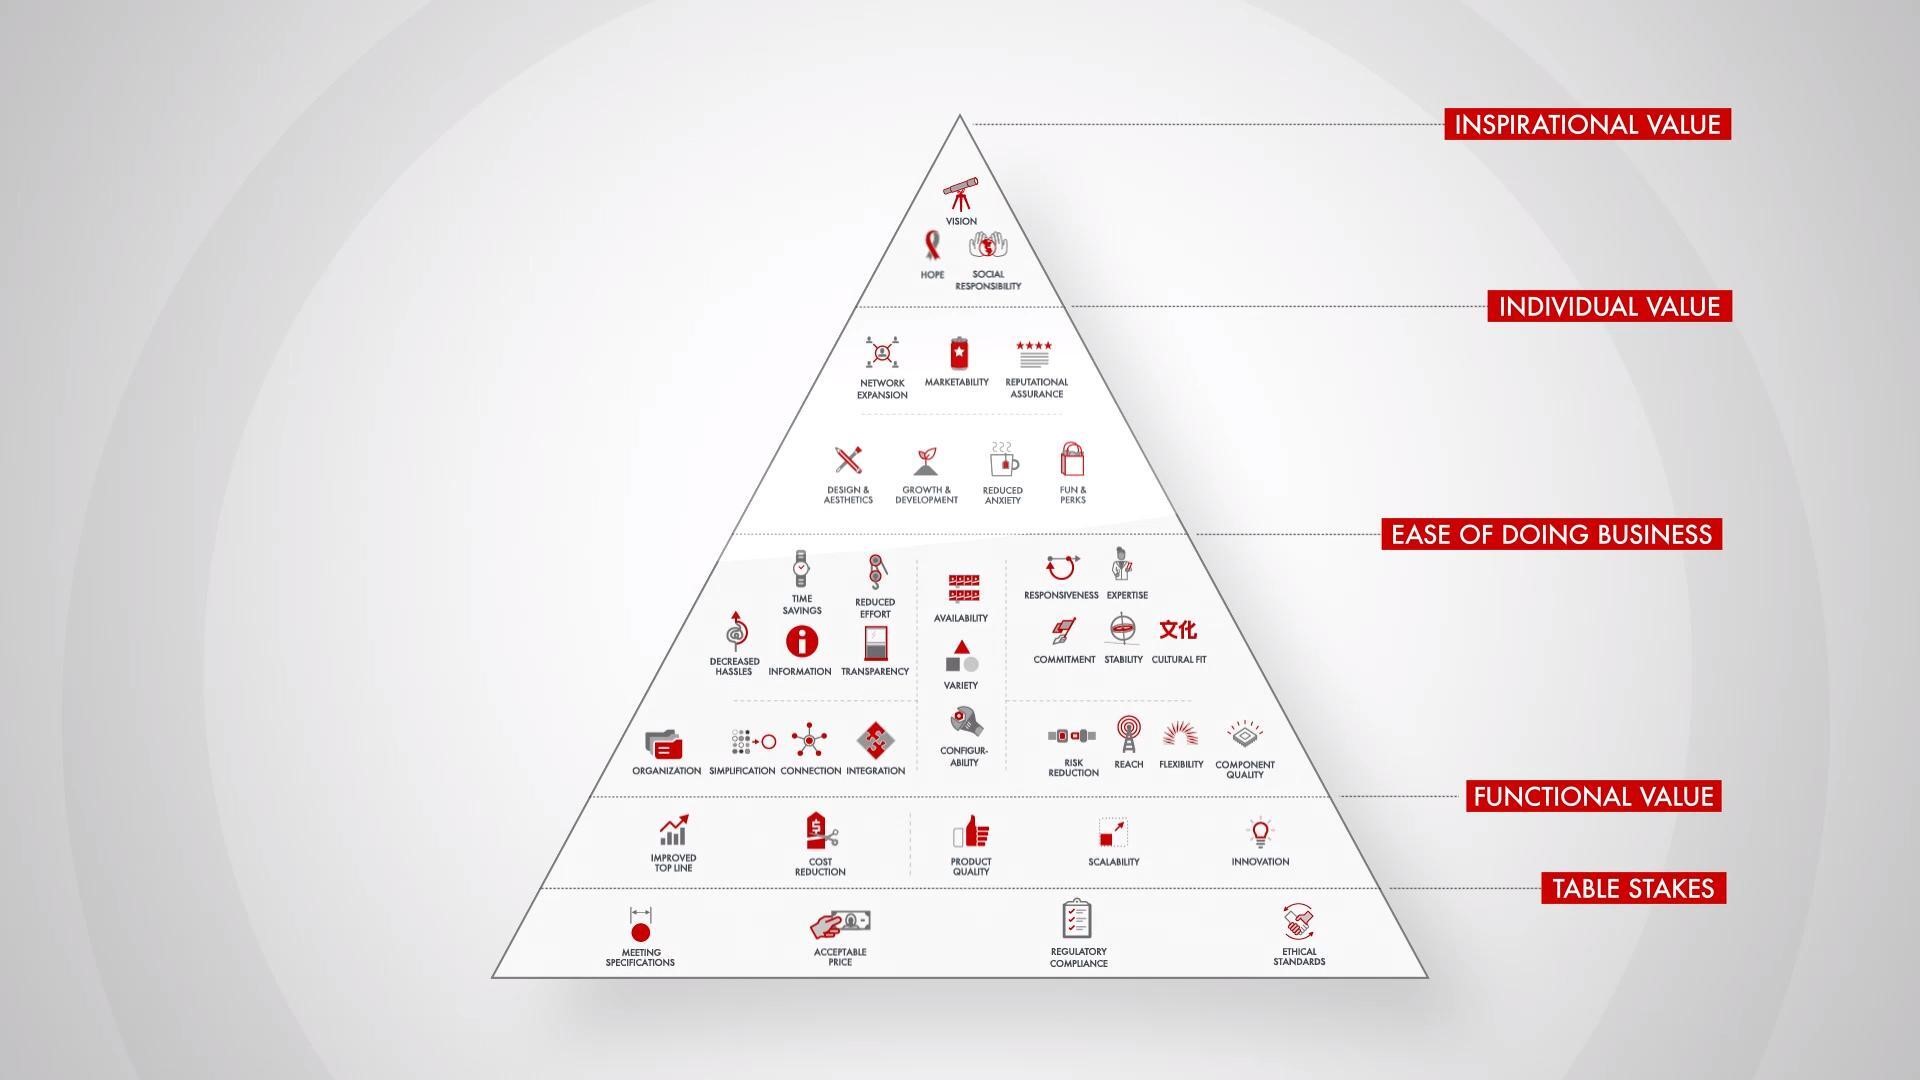
Bain’s Elements of Value Framework
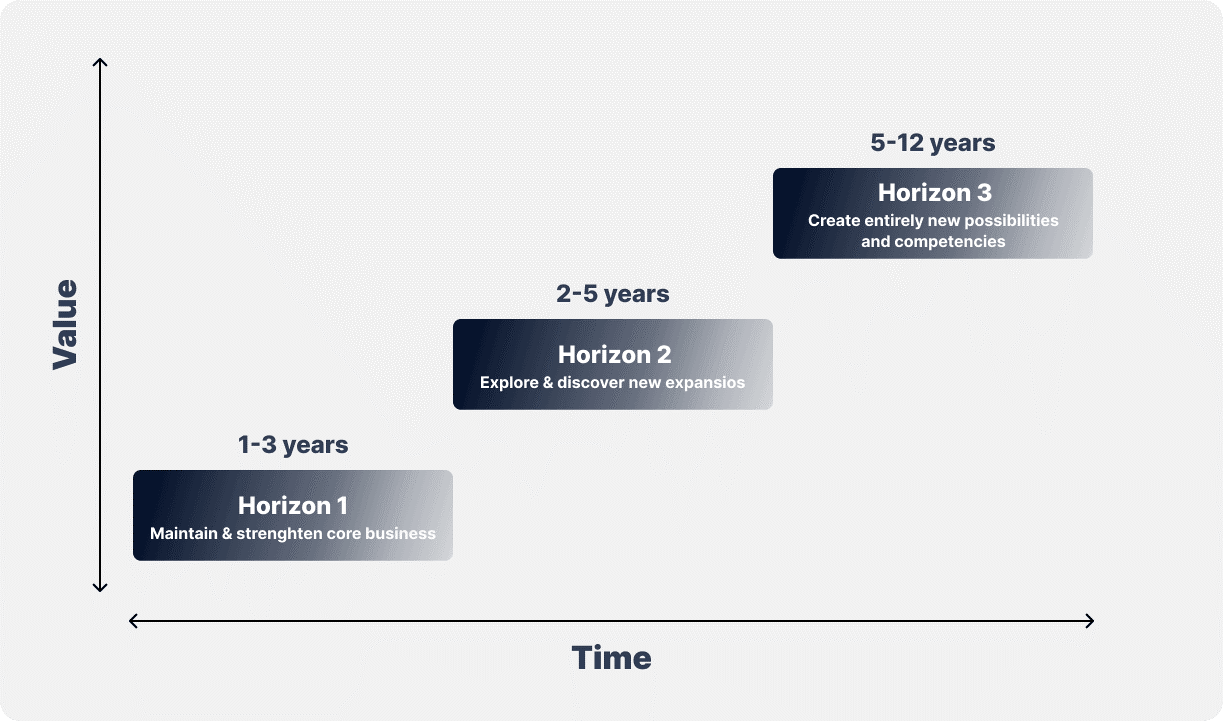
McKinsey Growth Pyramid
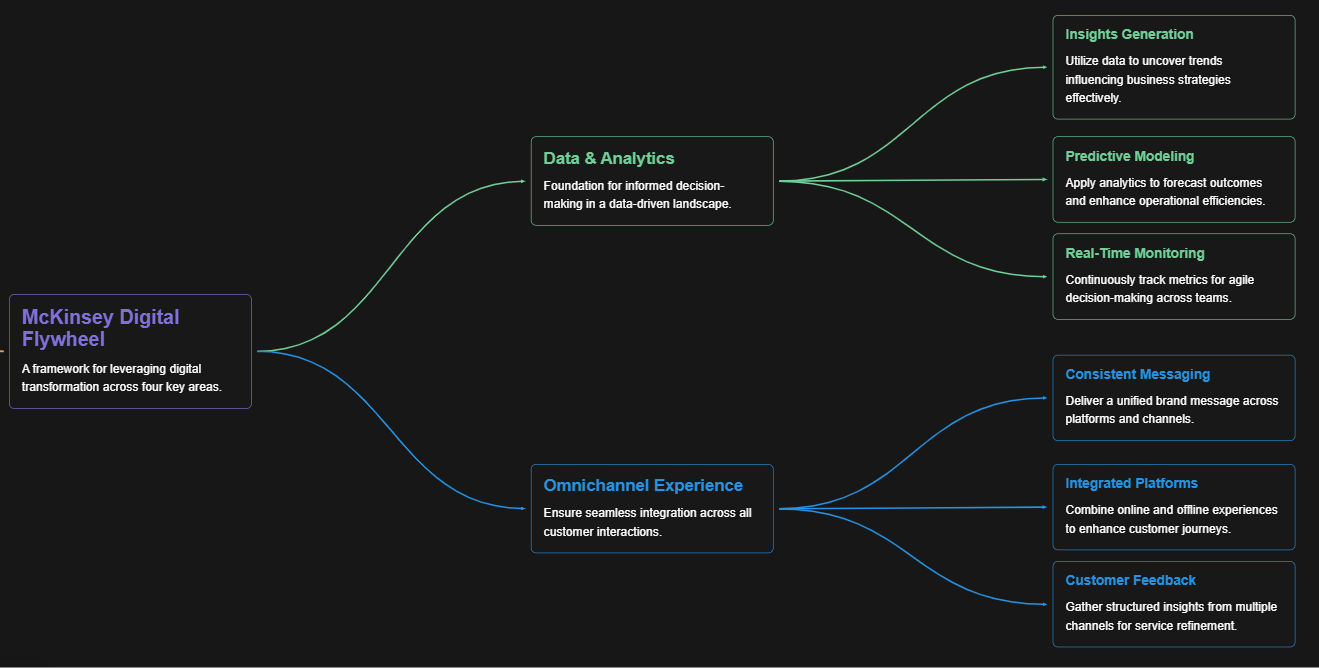
McKinsey Digital Flywheel
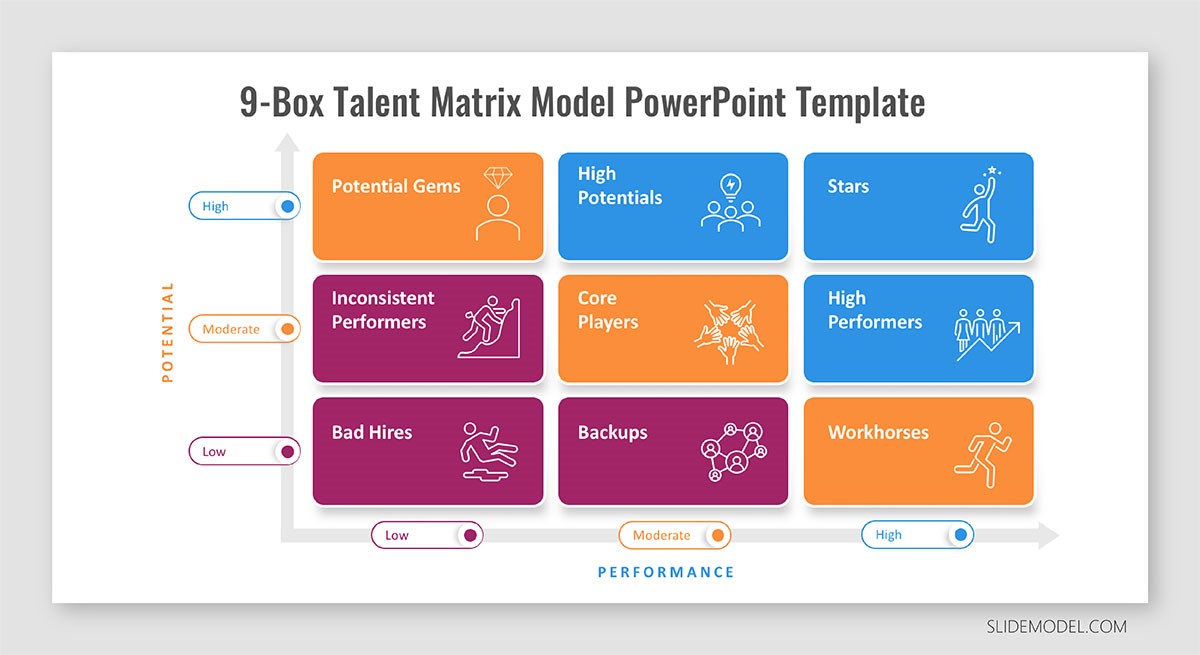
McKinsey 9-Box Talent Matrix
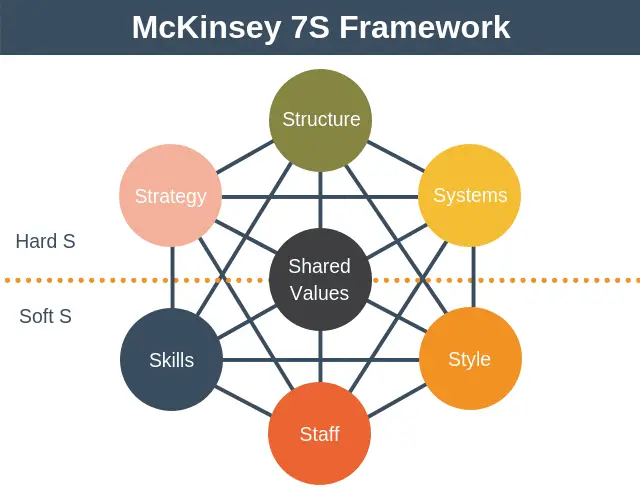
McKinsey 7S Framework
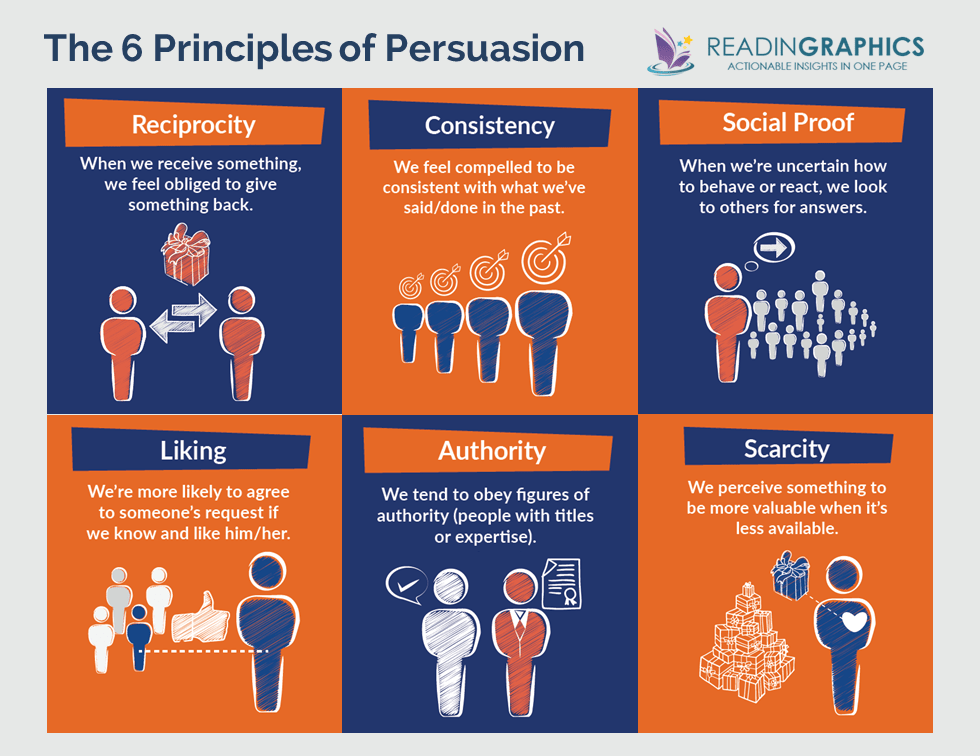
The Psychology of Persuasion in Marketing
The Influence of Colors on Branding and Marketing Psychology


