Clickstream and Behavioral Analytics: Decoding Digital Customer Journeys
Marcus, a UX director at a leading fintech company, experienced a revelation that changed his approach to user experience optimization. While reviewing their mobile banking app analytics, he discovered that 67% of users attempting to open new savings accounts abandoned the process at the third step of a seven-step flow. Traditional conversion metrics showed this as a simple drop-off statistic, but deeper clickstream analysis revealed that users were actually toggling between the app and their web browser, researching interest rates and terms before returning. They weren't abandoning due to poor UX—they were conducting due diligence. This insight led Marcus to redesign the flow with integrated comparison tools and educational content, resulting in a 41% increase in account opening completions within three months.
This discovery illustrates the transformative power of behavioral analytics in understanding not just what users do, but why they do it. Modern clickstream analysis goes far beyond page views and click counts, revealing the psychological and contextual factors that drive user behavior across digital touchpoints.
Introduction: The Behavioral Revolution in Digital Analytics
Digital customer behavior has become increasingly complex as users navigate sophisticated multi-device, multi-platform journeys. Research from the Digital Analytics Association indicates that modern users interact with an average of 4.2 devices and 8.7 digital touchpoints during a typical purchase journey, creating intricate behavioral patterns that traditional analytics often miss.
Clickstream and behavioral analytics have evolved from simple tracking mechanisms to sophisticated psychological profiling systems that decode user intent, emotional states, and decision-making patterns. These advanced analytics approaches enable organizations to understand not just the mechanics of user interaction, but the underlying motivations and barriers that influence digital behavior.
Companies implementing comprehensive behavioral analytics strategies report 34% higher conversion rates and 28% lower customer acquisition costs compared to organizations relying solely on traditional metrics, according to research from the Institute of Digital Marketing.
1. Understanding User Paths, Drop-offs, and Conversions
Advanced User Journey Mapping
Modern behavioral analytics platforms create detailed journey maps that visualize every interaction across devices and sessions. These sophisticated visualizations reveal the non-linear nature of modern customer journeys, showing how users move between awareness, consideration, and conversion phases across multiple touchpoints and time periods.
Session reconstruction technology enables analysts to replay individual user sessions, understanding the micro-interactions that influence macro-behaviors. These detailed session analyses reveal user hesitation points, areas of confusion, and moments of engagement that traditional aggregate metrics cannot capture.
Cohort-based journey analysis segments users by acquisition source, demographic characteristics, or behavioral patterns, revealing how different user groups navigate digital experiences differently. This segmented approach enables personalized optimization strategies that address the specific needs and behaviors of distinct user segments.
Conversion Funnel Optimization
Multi-dimensional funnel analysis examines conversion paths across devices, channels, and time periods. Modern analytics platforms track users as they move between mobile apps, desktop websites, and offline touchpoints, creating comprehensive conversion attribution that reveals the true customer journey.
Micro-conversion tracking identifies smaller engagement actions that predict macro-conversions. These leading indicators—such as time spent on product pages, interaction with comparison tools, or engagement with educational content—enable proactive optimization before users reach traditional conversion points.
Advanced statistical techniques like survival analysis predict the probability of conversion at each stage of the customer journey. These predictive models enable marketing teams to identify users at risk of abandonment and deploy targeted interventions to improve conversion rates.
Drop-off Analysis and Recovery Strategies
Behavioral segmentation of abandoning users reveals distinct patterns and motivations behind different types of drop-offs. Price-sensitive abandoners behave differently from feature-comparison abandoners, requiring tailored re-engagement strategies.
Exit intent detection algorithms analyze mouse movements, scroll patterns, and interaction timing to predict when users are likely to abandon. These predictive signals enable real-time interventions such as targeted offers, helpful content, or streamlined checkout processes.
Post-abandonment journey tracking follows users who leave without converting, understanding their subsequent behavior across channels. This analysis reveals opportunities for retargeting, email recovery campaigns, and cross-channel re-engagement strategies.
2. Visualization Tools and Platforms
Google Analytics 4 Advanced Implementation
GA4's event-based measurement model enables sophisticated behavioral tracking that goes beyond traditional page views. Custom event implementation captures user interactions with specific interface elements, content engagement patterns, and micro-conversions that indicate user intent.
Enhanced e-commerce tracking in GA4 provides granular insights into shopping behavior, including product affinity analysis, category preferences, and purchase decision factors. These insights enable personalized product recommendations and targeted promotional strategies.
Audience building capabilities in GA4 create behavioral segments based on complex interaction patterns. These dynamic audiences automatically update based on ongoing user behavior, enabling real-time personalization and targeted marketing campaigns.
Heatmap and User Recording Platforms
Advanced heatmap technologies now incorporate scroll depth, attention mapping, and interaction intensity to create comprehensive visual representations of user engagement. These tools reveal which content elements capture attention and which are ignored, informing content optimization strategies.
Session recording platforms utilize AI-powered analysis to identify frustration signals such as rage clicks, error encounters, and navigation confusion. Automated analysis of thousands of sessions reveals common user experience issues that might be missed in manual review.
Form analytics capabilities track field-level interactions, revealing specific friction points in conversion forms. These insights identify which form fields cause abandonment, how users interact with different input types, and opportunities for form optimization.
Behavioral Flow Analysis Tools
Sankey diagrams and flow visualization tools reveal the most common paths users take through digital experiences. These visualizations identify popular routes, unexpected behaviors, and optimization opportunities that might not be apparent in traditional reports.
Path analysis algorithms identify the sequences of actions that lead to successful outcomes versus those that predict abandonment. This analysis enables the optimization of user flows to guide users toward desired behaviors more effectively.
Multi-touch attribution modeling within behavioral analytics platforms reveals how different touchpoints contribute to conversion across the entire customer journey. These insights inform both UX optimization and marketing attribution decisions.
3. UX and Content Optimization Applications
User Experience Enhancement Strategies
Behavioral data drives evidence-based UX design decisions by revealing actual user preferences rather than assumptions. A/B testing frameworks incorporate behavioral metrics beyond conversion rates, including engagement quality, task completion efficiency, and user satisfaction indicators.
Personalization engines utilize behavioral patterns to customize user experiences in real-time. These systems adapt interface elements, content presentation, and navigation flows based on individual user behavior patterns and preferences.
Accessibility optimization uses behavioral analytics to identify user groups with different interaction patterns, revealing potential accessibility barriers and opportunities to improve inclusive design.
Content Performance and Optimization
Content engagement analytics measure not just consumption but comprehension and action-driving effectiveness. Advanced metrics include reading depth, engagement intensity, and subsequent behavior patterns that indicate content effectiveness.
Dynamic content optimization systems automatically adjust content presentation based on user behavior patterns. These systems test different headlines, images, and calls-to-action to optimize engagement for different user segments.
Content journey mapping reveals how users consume content across multiple sessions and touchpoints. This analysis informs content sequencing strategies and identifies opportunities for cross-content promotion and user education.
Conversion Rate Optimization Framework
Behavioral insight-driven CRO combines quantitative analytics with qualitative user feedback to create comprehensive optimization strategies. This approach ensures that improvements address both statistical performance and user experience quality.
Progressive profiling strategies use behavioral data to determine the optimal timing and context for requesting user information. This approach reduces form abandonment while maximizing data collection effectiveness.
Dynamic pricing and offer optimization systems utilize behavioral signals to present personalized incentives that match user decision-making patterns and price sensitivity indicators.
Case Study: Netflix's Behavioral Analytics Revolution
Netflix has built one of the world's most sophisticated behavioral analytics platforms to understand and optimize user engagement across their global streaming service. The company analyzes over 100 billion behavioral events daily from 230 million subscribers across different devices and regions.
Netflix's behavioral analytics system tracks micro-interactions including pause patterns, rewind frequency, subtitle usage, and browsing behavior. The platform identifies content preferences not just based on what users watch, but how they watch it—distinguishing between background viewing and focused attention.
Their recommendation engine incorporates behavioral signals beyond viewing history, including the time users spend browsing different categories, their response to artwork variations, and their engagement patterns throughout different parts of content. The system identifies when users are likely to cancel their subscription based on viewing pattern changes and engagement decline.
Netflix developed sophisticated A/B testing frameworks that simultaneously test multiple interface variations with different user segments. Their behavioral analytics inform everything from thumbnail selection to content acquisition decisions, with the platform conducting over 250 concurrent experiments at any given time.
The results demonstrate the power of comprehensive behavioral analytics. Netflix maintains industry-leading retention rates with monthly churn below 2.5% in most markets. Their personalization algorithms drive over 80% of viewing hours, and their content optimization based on behavioral insights has contributed to their expansion into over 190 countries.
The behavioral insights also inform content creation decisions, with Netflix analyzing viewing patterns to understand optimal episode lengths, series structures, and content themes that resonate with different audience segments.
Conclusion: The Future of Behavioral Intelligence
The evolution of clickstream and behavioral analytics represents a fundamental shift from measuring what happened to understanding why it happened and predicting what will happen next. Organizations that master behavioral intelligence position themselves to create more intuitive, engaging, and conversion-optimized digital experiences.
As machine learning and artificial intelligence capabilities advance, behavioral analytics will become more predictive and automated. Future systems will anticipate user needs before they are explicitly expressed, creating seamless experiences that feel almost telepathic in their responsiveness to user intent.
The competitive advantage belongs to organizations that view behavioral data not as historical reporting but as real-time intelligence that drives continuous experience optimization and user satisfaction improvement.
Call to Action
For digital leaders seeking to harness the power of behavioral analytics:
- Implement comprehensive event tracking that captures micro-interactions and user intent signals
- Deploy advanced visualization tools that make behavioral patterns accessible to cross-functional teams
- Develop testing frameworks that incorporate behavioral metrics beyond traditional conversion rates
- Create behavioral segmentation strategies that enable personalized user experiences
- Establish continuous optimization processes that translate behavioral insights into interface improvements
- Build cross-functional analytics literacy that enables teams to interpret and act on behavioral data
Success in the digital age requires understanding not just what users do, but why they do it—and behavioral analytics provides the key to unlocking these essential insights.
Featured Blogs
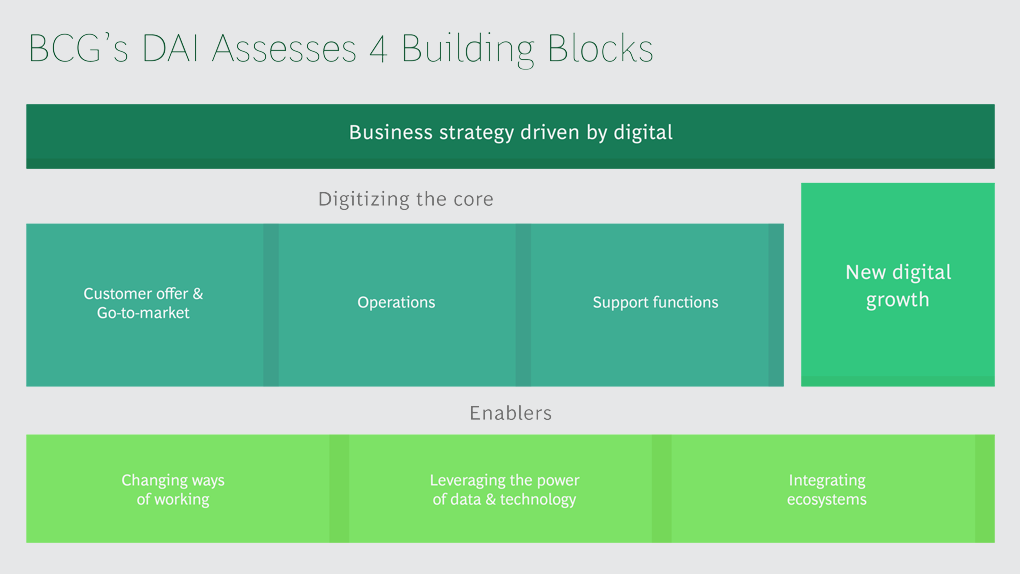
BCG Digital Acceleration Index
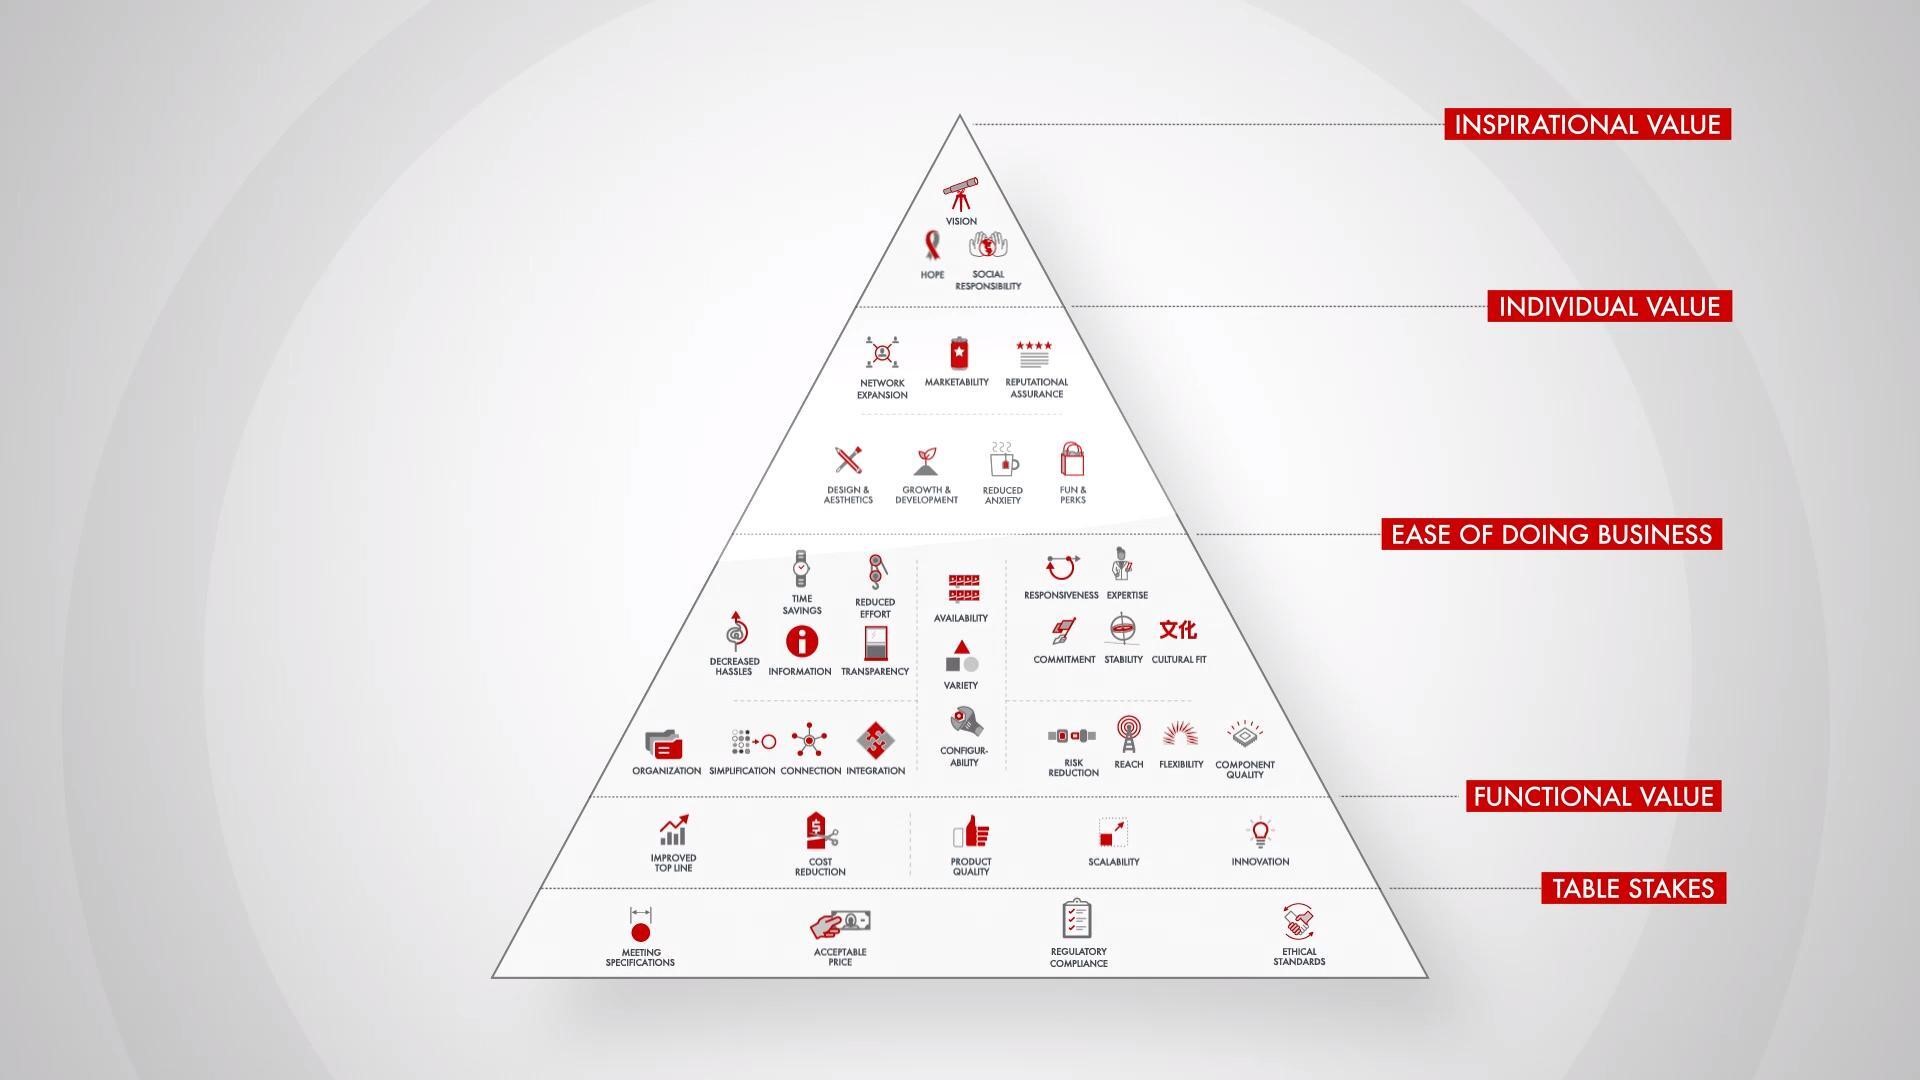
Bain’s Elements of Value Framework
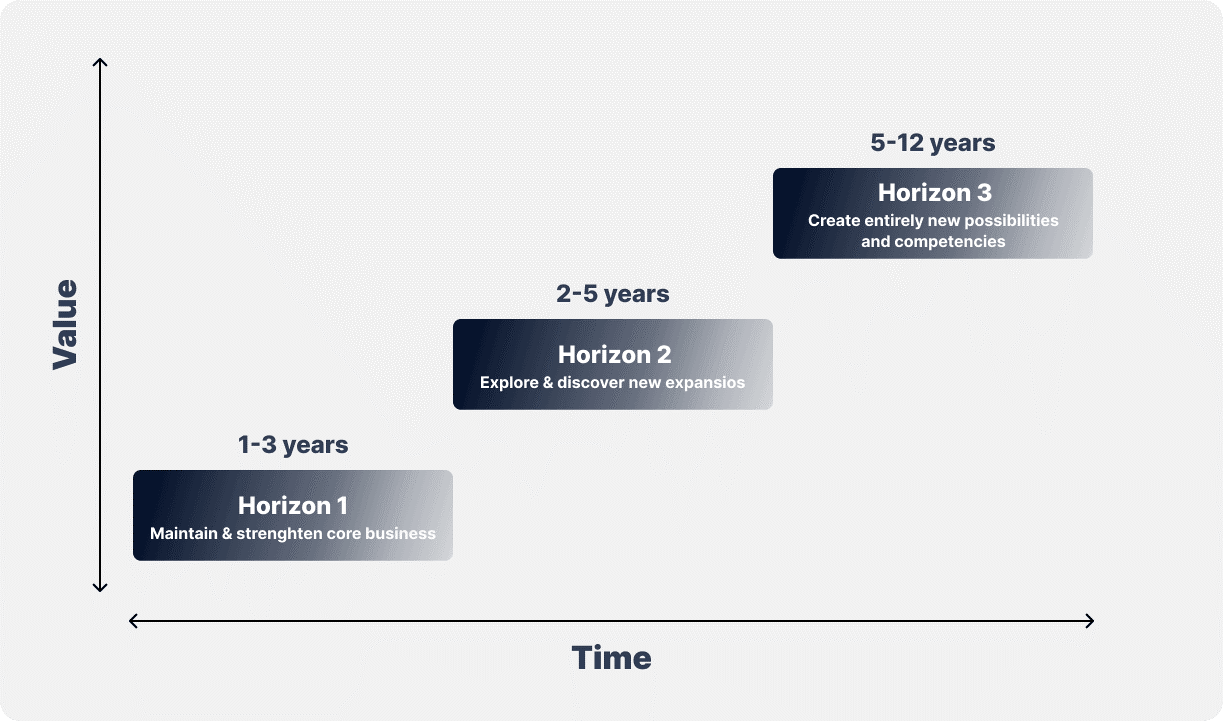
McKinsey Growth Pyramid
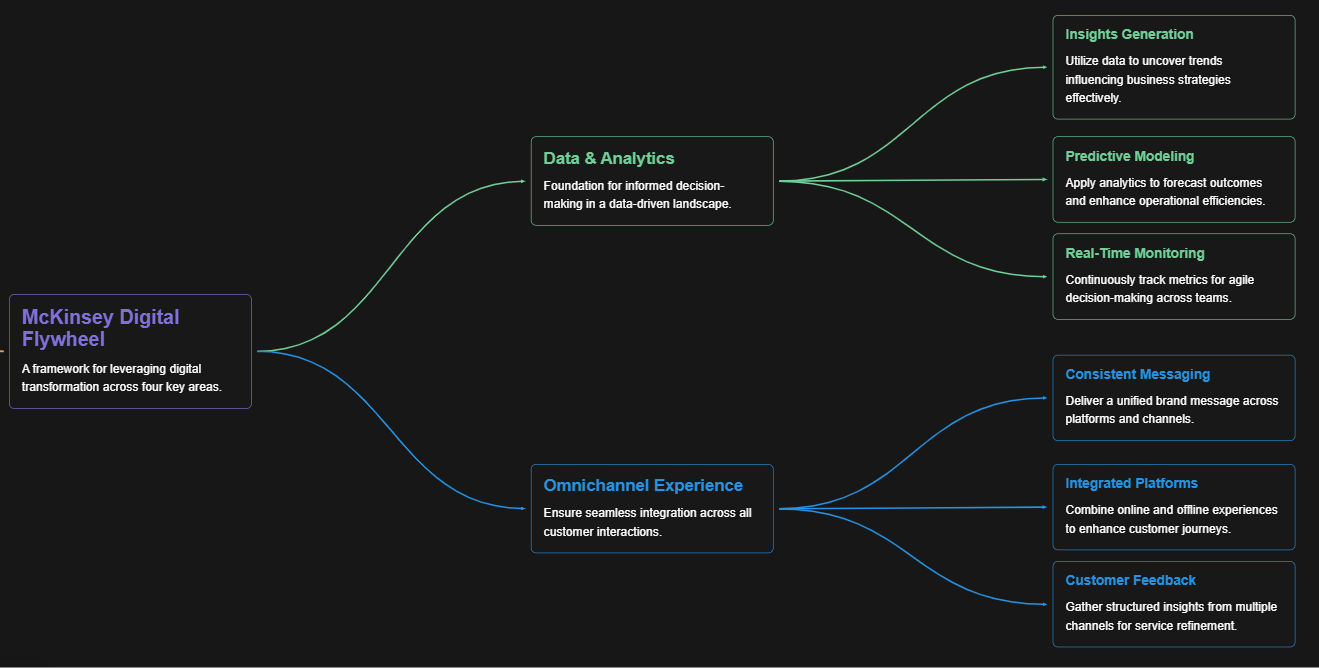
McKinsey Digital Flywheel
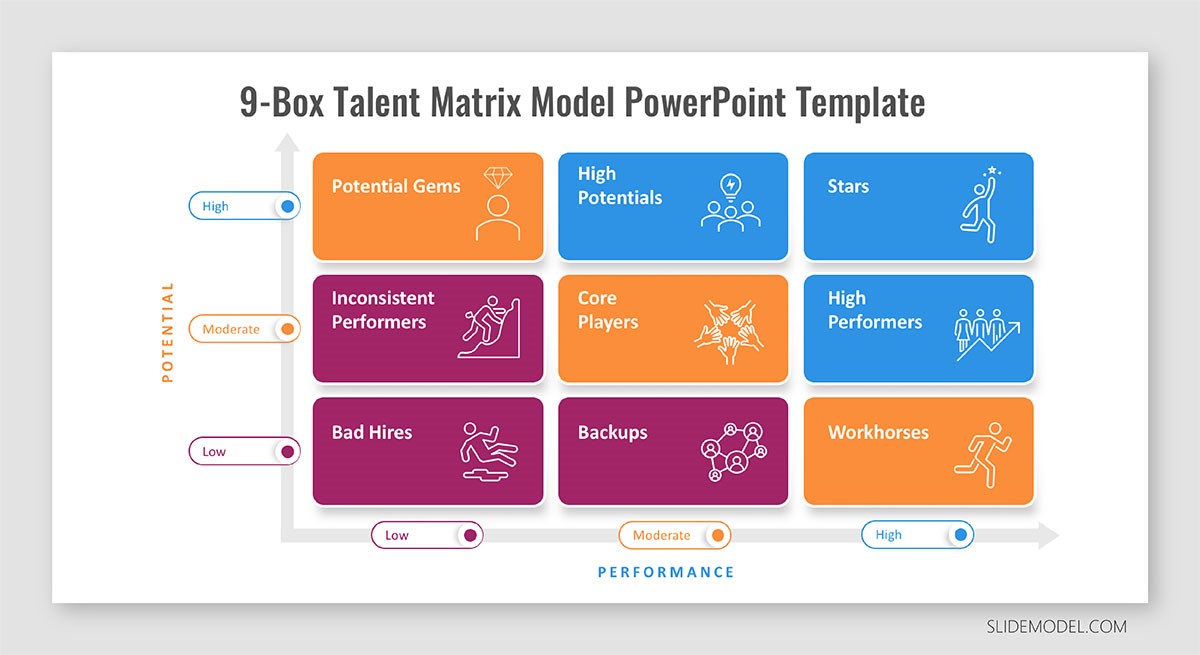
McKinsey 9-Box Talent Matrix
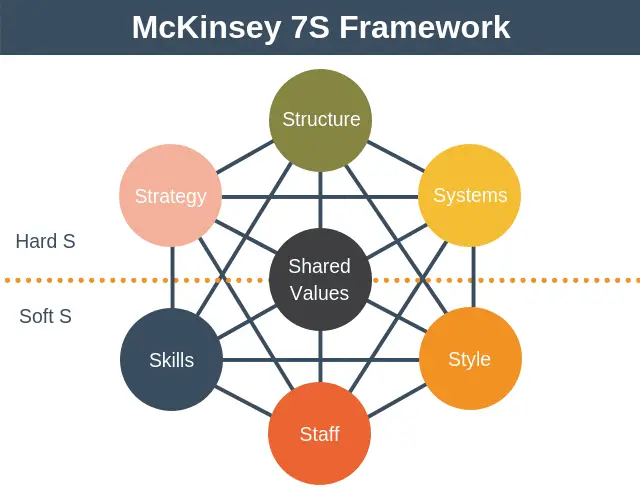
McKinsey 7S Framework
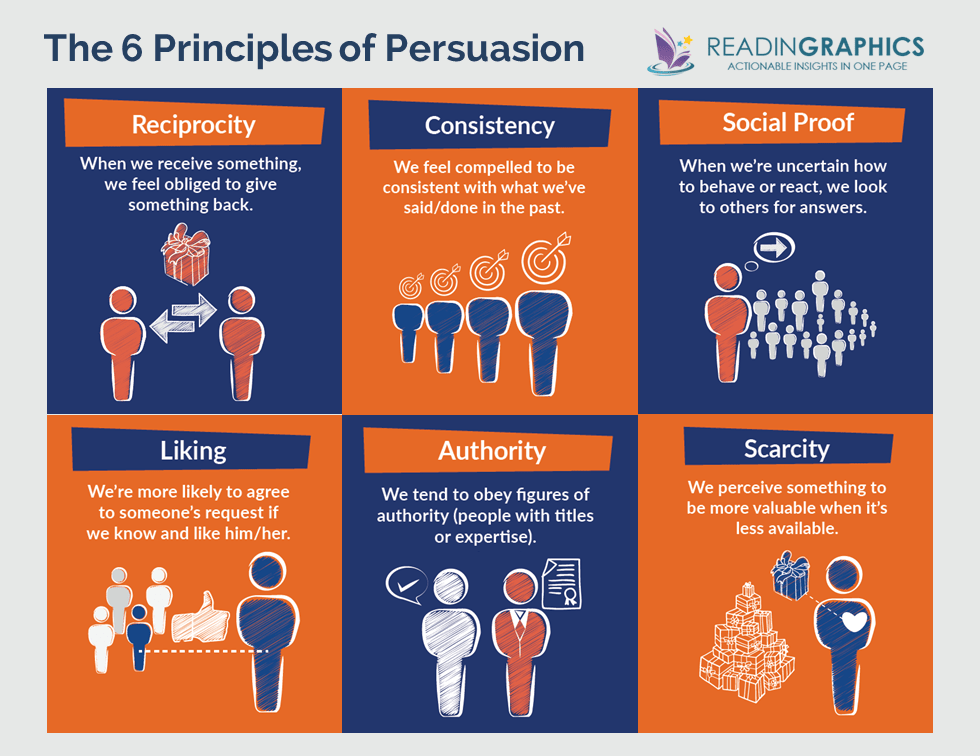
The Psychology of Persuasion in Marketing
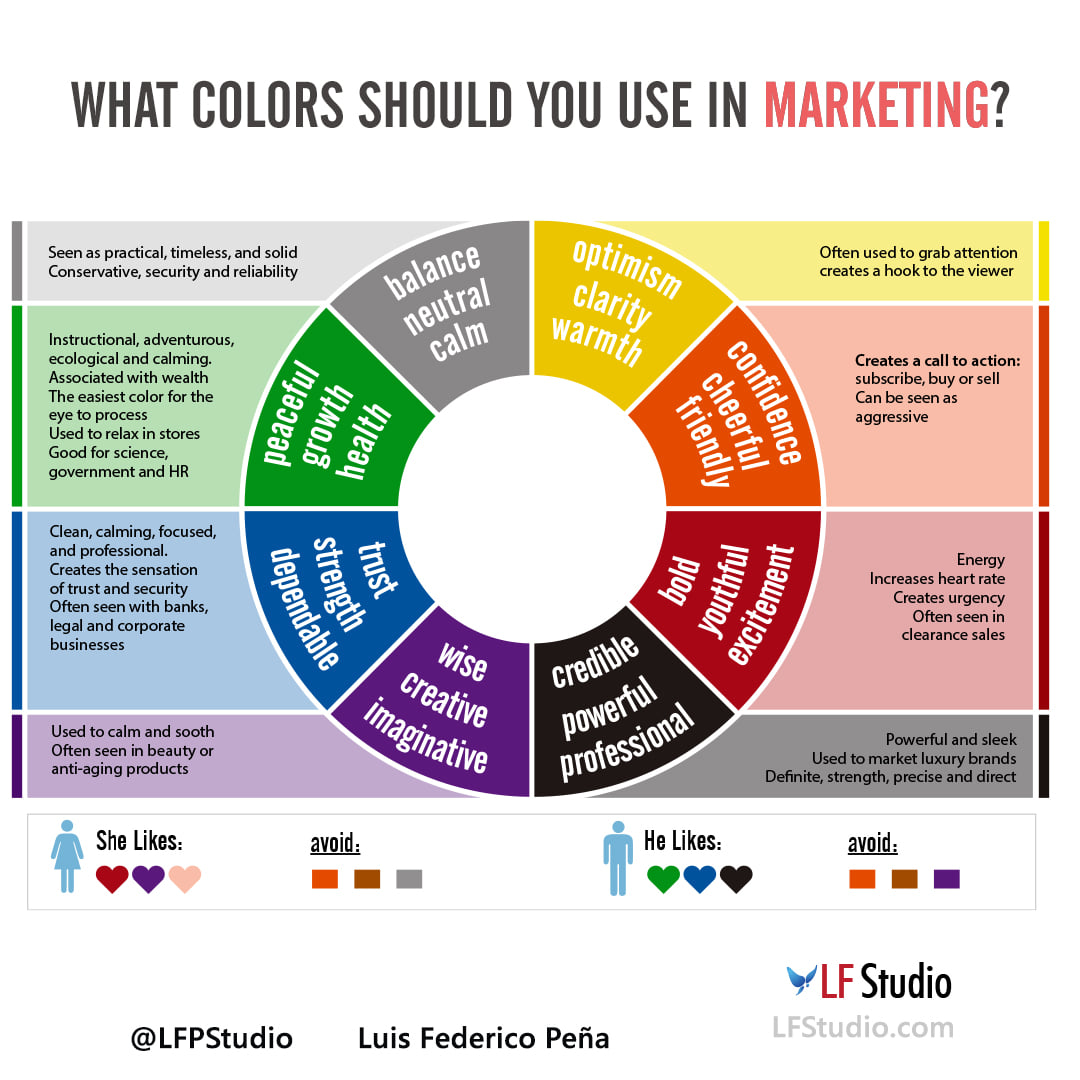
The Influence of Colors on Branding and Marketing Psychology


