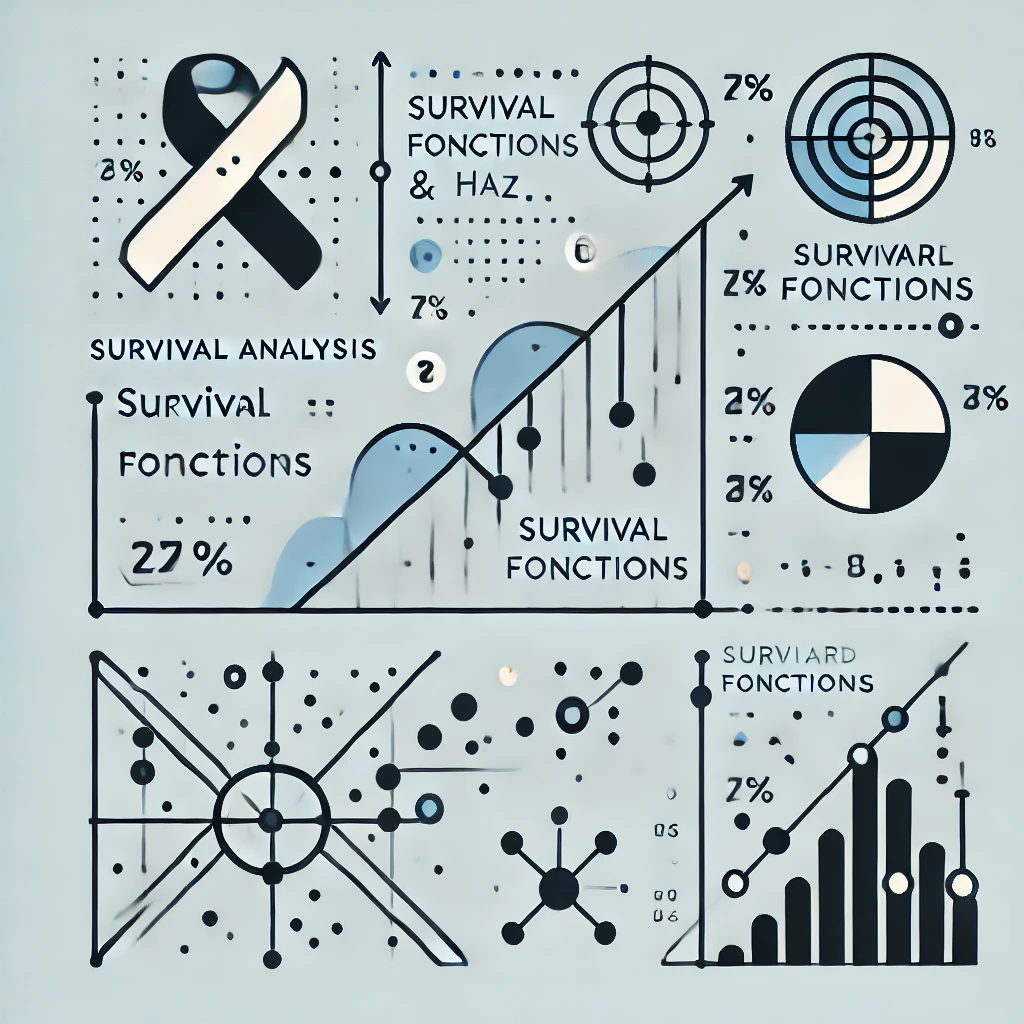
Survival Analysis and Hazard Functions
Survival analysis is a branch of statistics that focuses on analyzing time-to-event data. This type of data represents the time it takes for an event of interest to occur, such as the failure of a machine, the recurrence of a disease, or the departure of a customer from a service. Unlike traditional statistical methods, survival analysis accounts for censored data, meaning that for some subjects, the event may not have occurred within the observed time frame. This makes survival analysis particularly useful in fields where tracking events over time is critical. A key concept in survival analysis is the hazard function, which measures the instantaneous risk of an event occurring at a specific time, given that the subject has survived up to that time. Understanding survival analysis and hazard functions helps researchers and analysts make data-driven decisions in various fields, including healthcare, engineering, finance, and marketing.
Table of Contents
- Fundamental Principles of Survival Analysis
- Basics of Survival Analysis
- Censoring and Its Types
- Kaplan-Meier Estimator
- Cox Proportional Hazards Model
- Hazard Function and Its Interpretation
- Applications
- Significance
- Implementation in Python
- Conclusion
Fundamental Principles of Survival Analysis
Basics of Survival Analysis
Survival analysis models the time until an event occurs. The primary components include:
- Survival Function (S(t)): The probability of surviving beyond time t.
- Hazard Function (h(t)): The instantaneous risk of event occurrence at time t.
- Censoring: When the event has not occurred during the study period.
Censoring and Its Types
Censoring occurs when we do not observe the event for some subjects. Types of censoring include:
- Right Censoring: The event has not occurred by the end of the study.
- Left Censoring: The event occurred before the study began.
- Interval Censoring: The event occurred within an interval, but the exact time is unknown.
Kaplan-Meier Estimator
The Kaplan-Meier estimator is a non-parametric method for estimating the survival function. It calculates survival probabilities at different time points and is widely used in medical studies.
The Kaplan-Meier survival function is given by:
S(t) = πti≤t(1 - ![]() )
)
Where d_i is the number of events at time t_i, and n_i is the number of subjects at risk before time t_i.
Cox Proportional Hazards Model
The Cox proportional hazards model is a semi-parametric model that estimates the effect of covariates on survival time.
The hazard function is given by:
h(t) = h0(t)e(β1X1 + β2X2 + β3X3 + …… + βnXn)
where h_0(t) is the baseline hazard, and X_i are covariates.
Hazard Function and Its Interpretation
The hazard function is a fundamental concept in survival analysis that describes the risk of an event occurring at a given time, given that the subject has survived up to that point. It provides insight into the likelihood of failure or event occurrence over time. The hazard function is mathematically defined as:
h(t) = limΔt→0![]()
where T represents the time-to-event variable, and h(t) represents the instantaneous rate at which the event is occurring at time t.
Types of Hazard Functions
The shape of the hazard function varies depending on the nature of the event being studied. Some common types include:
- Constant Hazard Function:
- The event occurs at a constant rate over time.
- Common in processes with a fixed probability of failure, such as radioactive decay or light bulb failures modeled using an exponential distribution.
- Increasing Hazard Function:
- The risk of the event occurring increases over time.
- Frequently observed in aging populations, where the probability of disease or failure increases with time.
- Used in Weibull distributions for modeling wear and tear in mechanical systems.
- Decreasing Hazard Function:
- The risk decreases over time.
- Common in medical treatments where the probability of relapse declines after initial treatment.
- Seen in products with a high likelihood of early failure (infant mortality phase in reliability engineering).
- Non-monotonic Hazard Function:
- The risk increases and then decreases (or vice versa).
- Found in survival patterns of diseases with early and late mortality risks, or in business contexts where customer churn risk fluctuates over time.
Interpretation of the Hazard Function
- A high hazard function value at a given time t indicates a high likelihood of the event occurring at that moment.
- If the hazard function remains constant, the event likelihood does not change over time.
- A hazard function that decreases over time suggests that as time progresses, survival likelihood improves.
- If the hazard function increases, it signals that risk accumulates over time, requiring intervention strategies.
Applications
Survival analysis and hazard functions have wide-ranging applications, including:
1. Healthcare & Medicine
- Patient Survival Prediction: Estimating the survival probabilities of patients with chronic illnesses, such as cancer or heart disease.
- Effectiveness of Treatments: Comparing the survival rates of patients receiving different treatments, such as chemotherapy versus radiation therapy.
- Clinical Trials: Assessing the time until disease progression, recurrence, or death in drug trials.
- Organ Transplantation: Evaluating graft survival rates and patient survival post-transplant.
2. Engineering & Reliability Analysis
- Product Lifespan Estimation: Determining the expected time before equipment failure (e.g., engines, semiconductors, medical devices).
- Warranty Analysis: Helping manufacturers set warranty periods by estimating failure risks over time.
- Predictive Maintenance: Identifying the best time to service or replace components to avoid unexpected breakdowns.
3. Finance & Economics
- Loan Default Prediction: Estimating the probability that a borrower will default on a loan over time.
- Customer Lifetime Value (CLV): Modeling customer retention and predicting churn rates.
- Investment & Risk Analysis: Evaluating the survival of financial instruments or firms under economic downturns.
4. Social Sciences & Demographics
- Employment Studies: Examining the duration of unemployment or time until career advancement.
- Marriage & Divorce Analysis: Predicting the likelihood of marriage survival based on socio-economic factors.
- Crime Rate Studies: Evaluating recidivism rates and predicting the time until re-offense.
5. Marketing & Customer Retention
- Customer Churn Analysis: Predicting how long customers will stay subscribed to a service (e.g., Netflix, SaaS companies).
- Campaign Effectiveness: Assessing how long after an advertisement a customer makes a purchase.
- Subscription Services: Estimating the lifetime of customers in membership-based businesses.
6. Clinical & Epidemiological Research
- Infectious Disease Modeling: Estimating the time until recovery or death from diseases like COVID-19.
- Vaccine Effectiveness: Evaluating how long immunity lasts after vaccination.
- Disease Spread Predictions: Analyzing survival probabilities of different populations under epidemic conditions.
7. Legal & Risk Management
- Litigation Survival Analysis: Estimating how long court cases take before resolution.
- Risk of Policy Violations: Predicting when employees or individuals might violate corporate policies.
Significance
Understanding survival analysis is crucial for:
1. Handling Censored Data
- Unlike traditional statistical methods, survival analysis accommodates censored data, where the event of interest has not yet occurred for all subjects.
- This makes it particularly useful in longitudinal studies, clinical trials, and reliability testing.
2. Predicting Event Occurrence
- By estimating survival probabilities and hazard rates, survival analysis helps predict the likelihood of an event occurring at different time points.
- Useful in medicine (patient survival), finance (loan defaults), and engineering (system failures).
3. Risk Assessment and Decision-Making
- The hazard function provides insights into the risk of an event at any given time.
- Helps in designing risk mitigation strategies, such as preventive maintenance, medical interventions, or customer retention plans.
4. Comparing Groups and Treatments
- Methods like the Kaplan-Meier estimator and Cox proportional hazards model allow comparison between different groups (e.g., patients receiving different treatments).
- Helps in determining the effectiveness of medical treatments, marketing campaigns, or product lifespans.
5. Applications Across Multiple Domains
- Healthcare: Predicting patient survival, disease progression, and treatment effectiveness.
- Engineering: Estimating product lifetimes and optimizing maintenance schedules.
- Finance: Assessing credit risk and predicting loan defaults.
- Marketing: Understanding customer churn and improving retention strategies.
6. Optimization of Resource Allocation
- Organizations can allocate resources more effectively by understanding survival probabilities.
- Examples: Hospitals optimizing ICU beds, companies adjusting marketing budgets, or manufacturers planning spare parts inventory.
7. Enhancing Predictive Modeling
- Many machine learning applications integrate survival analysis for better risk prediction and personalized recommendations.
- Example: Personalized medicine, where treatment plans are tailored based on survival probabilities.
Implementation in Python
import numpy as np
import pandas as pd
import matplotlib.pyplot as plt
from lifelines import KaplanMeierFitter, CoxPHFitter
# Creating a sample dataset
data = pd.DataFrame({
    'Time': [5, 6, 6, 2, 4, 8, 10, 3, 7, 9]                          # Time to event or censoring
    'Event': [1, 1, 0, 1, 1, 0, 1, 1, 0, 1]                           # 1 = Event occurred, 0 = Censored
    'Age': [30, 40, 50, 35, 45, 60, 55, 38, 48, 52]        # Covariate
})
# Kaplan-Meier Fitter
kmf = KaplanMeierFitter()
kmf.fit(durations=data['Time'], event_observed=data['Event'])
# Plot the survival curve
plt.figure(figsize=(10,5))
kmf.plot_survival_function()
plt.title("Kaplan-Meier Survival Curve")
plt.xlabel("Time")
plt.ylabel("Survival Probability")
plt.grid()
plt.show()
# Cox Proportional Hazards Model
cph = CoxPHFitter()
cph.fit(data, duration_col='Time', event_col='Event')
# Print summary of results
cph.print_summary()
# Plot hazard function
plt.figure(figsize=(10,5))
cph.plot()
plt.title("Cox Proportional Hazards Model")
plt.show()
Conclusion
Survival analysis and hazard functions are essential tools for analyzing time-to-event data across various fields. They provide critical insights into risk assessment, predictive modeling, and decision-making. With Python's statistical libraries, implementing survival analysis is accessible and effective for researchers and practitioners alike. By leveraging techniques like Kaplan-Meier estimation and Cox regression, we can extract valuable information from censored data and make informed predictions. The ability to quantify survival probabilities and hazard risks enables professionals to optimize strategies, improve efficiency, and drive meaningful insights in various domains.
Featured Blogs
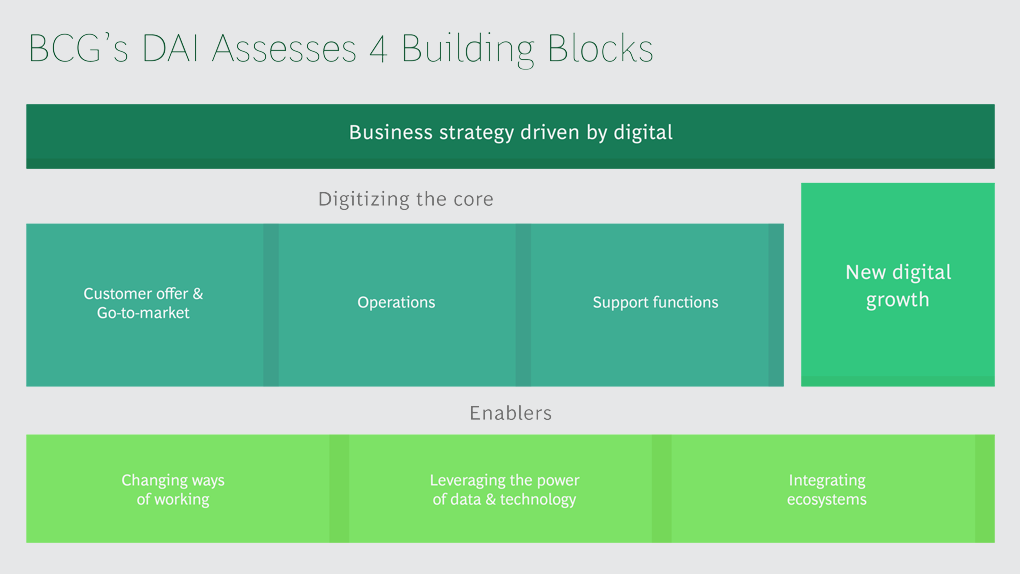
BCG Digital Acceleration Index
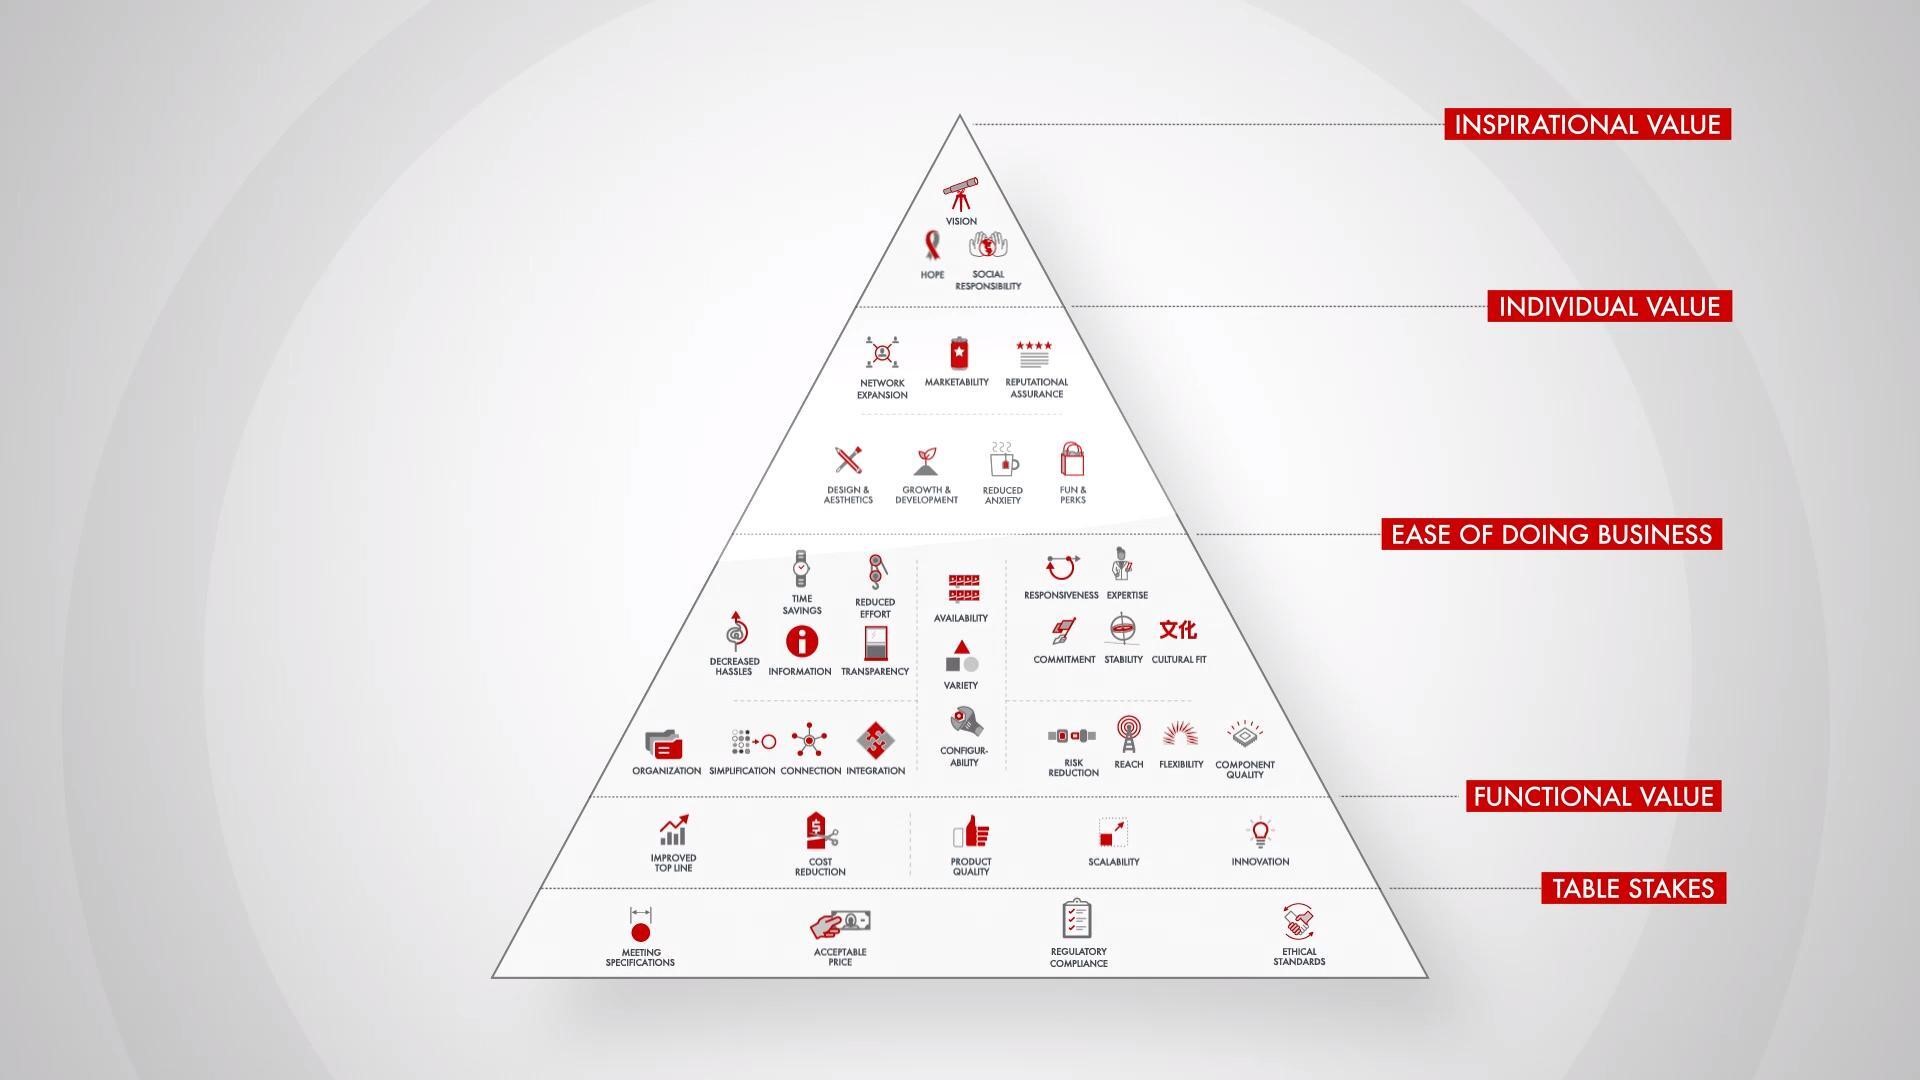
Bain’s Elements of Value Framework
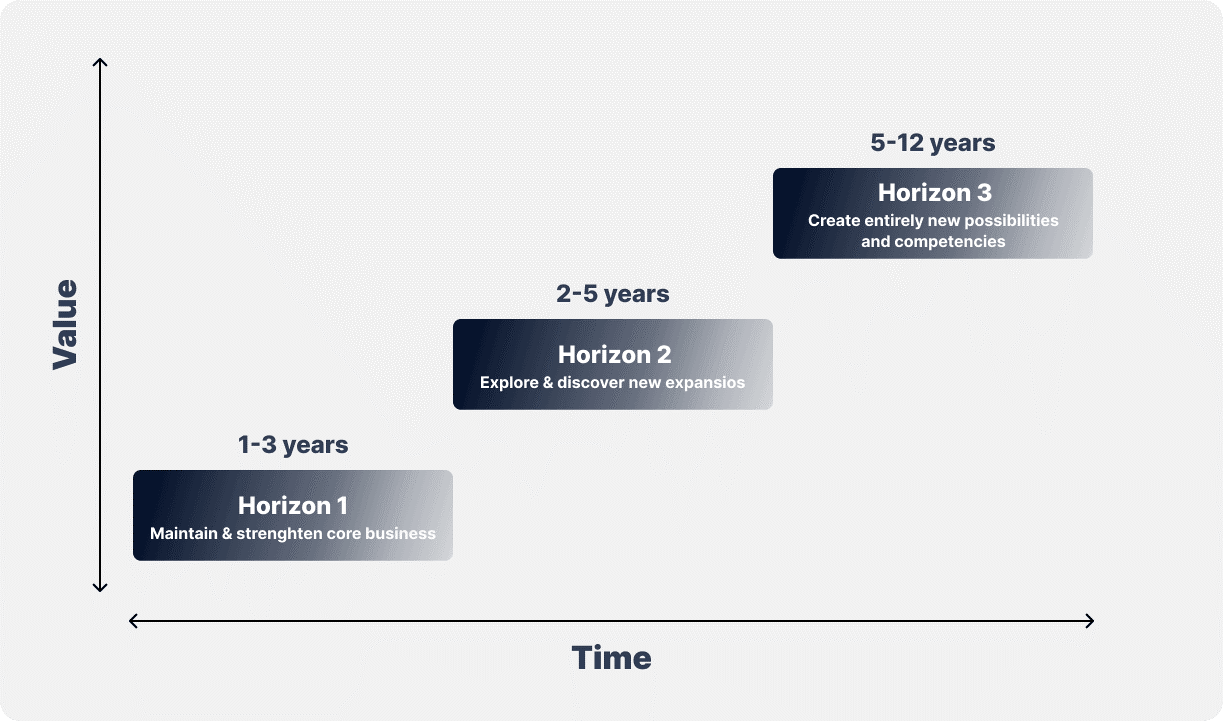
McKinsey Growth Pyramid
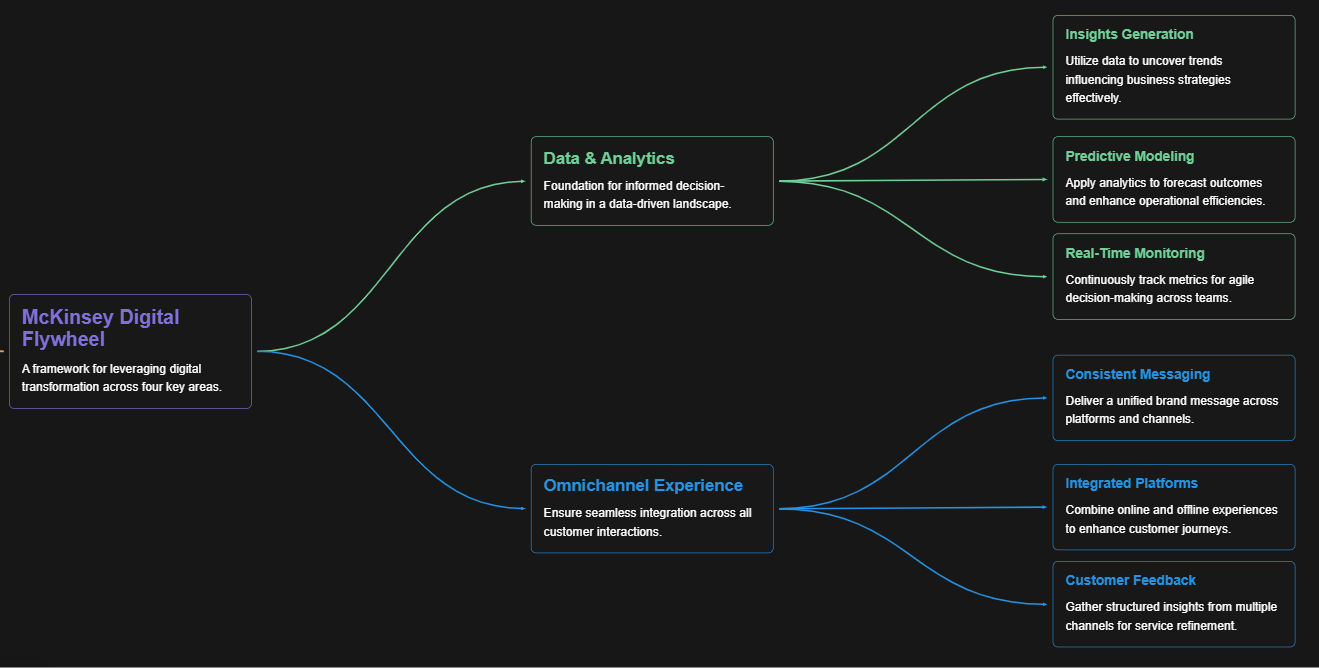
McKinsey Digital Flywheel
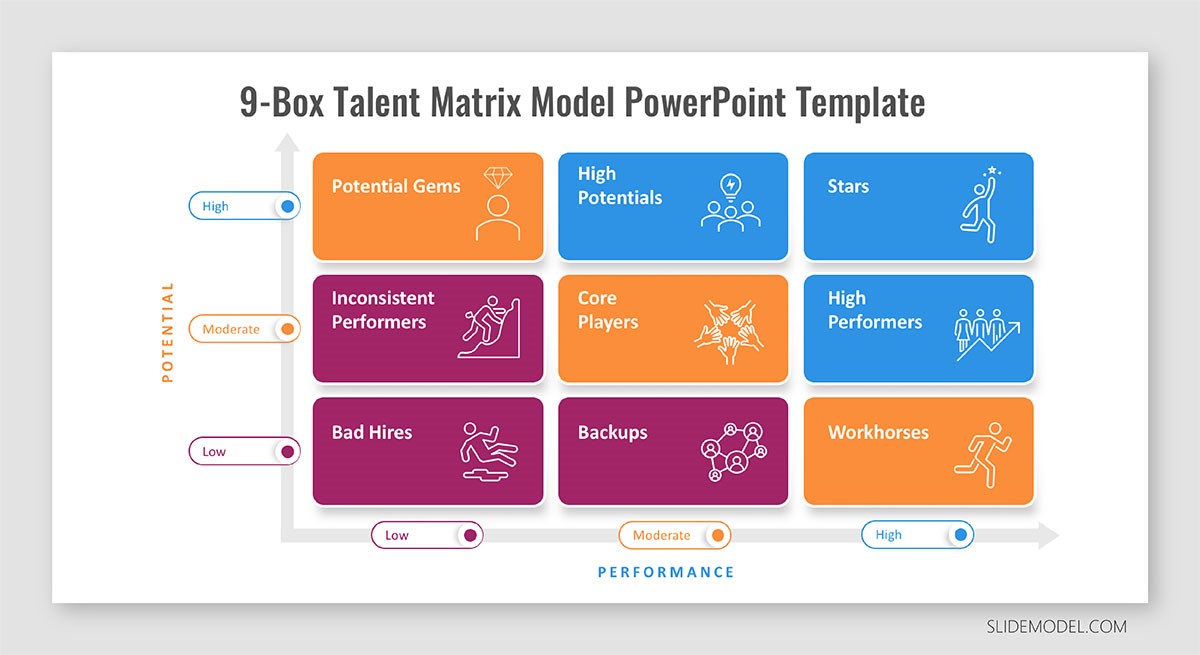
McKinsey 9-Box Talent Matrix
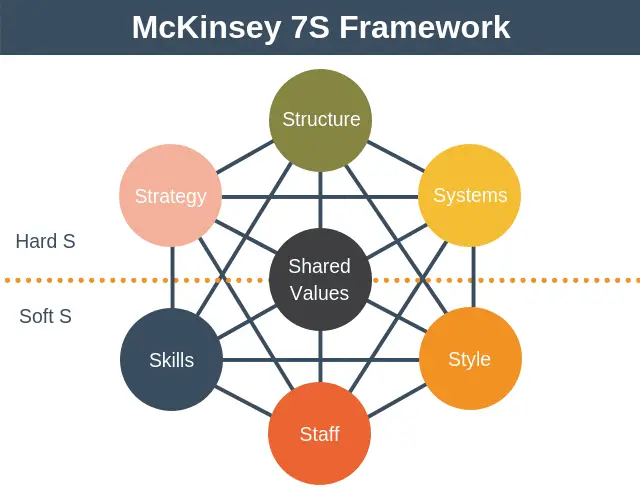
McKinsey 7S Framework
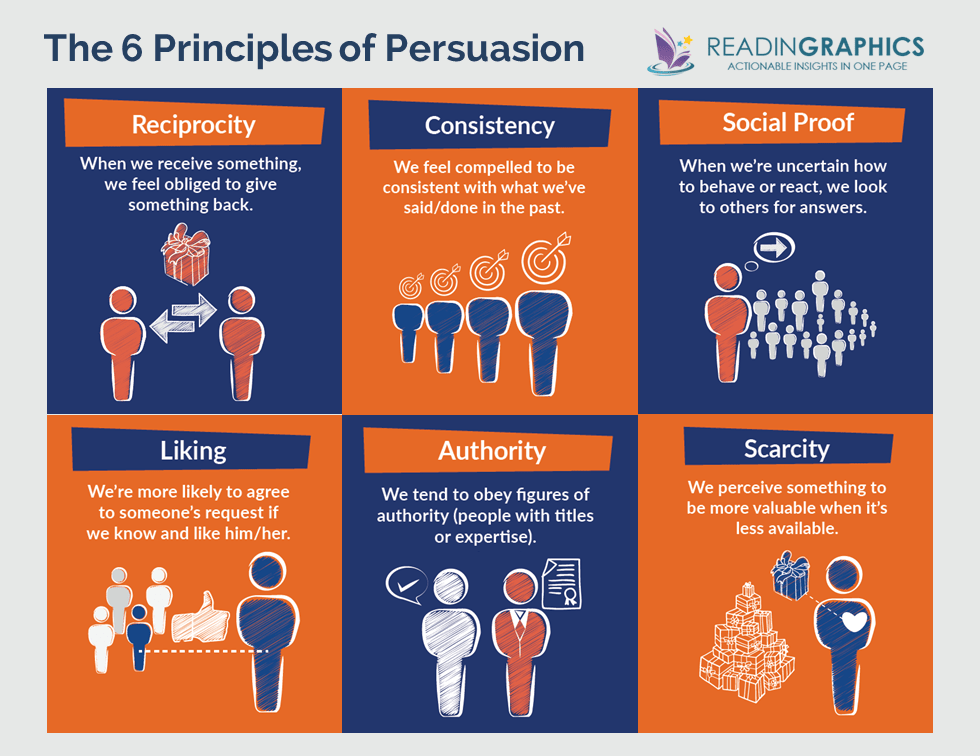
The Psychology of Persuasion in Marketing

The Influence of Colors on Branding and Marketing Psychology

What is Marketing?
Recent Blogs

Part 8: From Blocks to Brilliance – How Transformers Became Large Language Models (LLMs) of the series - From Sequences to Sentience: Building Blocks of the Transformer Revolution
Part 7: The Power of Now – Parallel Processing in Transformers of the series - From Sequences to Sentience: Building Blocks of the Transformer Revolution
Part 6: The Eyes of the Model – Self-Attention of the series - From Sequences to Sentience: Building Blocks of the Transformer Revolution
Part 5: The Generator – Transformer Decoders of the series - From Sequences to Sentience: Building Blocks of the Transformer Revolution

Part 4: The Comprehender – Transformer Encoders of the series - From Sequences to Sentience: Building Blocks of the Transformer Revolution of the series - From Sequences to Sentience: Building Blocks of the Transformer Revolution


