Pearson correlation and Spearman correlation
Correlation is a statistical measure used to analyze the relationship between two variables. It helps determine how changes in one variable correspond to changes in another.
- If both variables increase or decrease together, they have a positive correlation.
- If one variable increases while the other decreases, they have a negative correlation.
- If changes in one variable do not affect the other, the correlation is zero.
Pearson and Spearman correlation coefficients are two commonly used methods for assessing relationships between variables. While Pearson's correlation measures the linear association between variables, Spearman's correlation evaluates the monotonic relationship, which considers both linear and non-linear trends.
Table of Contents
- Pearson vs. Spearman Correlation
- Applications of Pearson and Spearman Correlation
- Importance of Pearson and Spearman Correlation
- Implementation of Pearson and Spearman Correlation in Python
- Conclusion
Pearson Correlation
Pearson’s correlation coefficient, developed by Karl Pearson, measures the linear relationship between two variables and is given by the formula:

Where:
- r = Pearson correlation coefficient
- X and Y = Data values of two variables
- Xˉ and Yˉ = Mean of XXX and YYY
- ∑ = Summation across all observations
Pearson’s Correlation produces a value ranging from -1 to 1, where 1 indicates a perfect positive relationship, and -1 signifies a perfect negative relationship.
This method relies on the mean and standard deviation in its calculation, classifying it as a parametric approach that assumes the data follows a normal (Gaussian-like) distribution. Due to its widespread use, Pearson’s Correlation is the default correlation method in many programming libraries. For instance, in Python’s Pandas library, the corr() function calculates Pearson’s correlation by default unless specified otherwise.
However, one limitation of Pearson’s Correlation is its sensitivity to outliers, which can distort results and lead to incorrect conclusions depending on the dataset.
Spearman’s Correlation
Spearman’s Correlation, developed by Charles Spearman, is a non-parametric alternative to Pearson’s Correlation. It is particularly useful in cases where:
- The relationship between two variables is non-linear, meaning the strength of the association varies across different values.
- The data does not follow a normal distribution, making Pearson’s Correlation unsuitable.
By ranking the data before calculating correlation, Spearman’s Correlation mitigates the influence of outliers and is more appropriate for non-Gaussian distributions or ordinal data

Where:
- Ρ is Spearman’s rank correlation coefficient.
- di represents the difference between the ranks of corresponding values of the two variables.
- n is the number of observations.
Like Pearson’s correlation, Spearman’s correlation also produces a value ranging from -1 to 1, where -1 indicates a perfect negative correlation, and 1 represents a perfect positive correlation.
Pearson vs. Spearman Correlation
The Pearson and Spearman correlation coefficients are statistical measures used to evaluate relationships between two variables. The table below highlights key differences between them:
| Aspect | Pearson Correlation Coefficient | Spearman Correlation Coefficient |
|---|---|---|
| Purpose | Measures linear relationships | Measures monotonic relationships |
| Assumptions | Assumes variables are normally distributed with a linear relationship | Assumes a monotonic relationship but makes no distribution assumptions |
| Calculation Method | Uses covariance and standard deviations | Based on ranking and rank order |
| Value Range | -1 to 1 | -1 to 1 |
| Interpretation | Measures strength and direction of linear relationships | Measures strength and direction of monotonic relationships |
| Sensitivity to Outliers | Highly sensitive to outliers | Less affected by outliers |
| Data Types | Best suited for interval and ratio data | Suitable for ordinal data and non-normally distributed data |
| Sample Size | Less effective for small samples | Works well with small sample sizes and does not require normality assumptions |
| Common Usage | Used for assessing linear associations in parametric tests | Applied to monotonic associations in non-parametric tests |
Applications of Pearson and Spearman Correlation
Both Pearson and Spearman correlation coefficients are widely applied in various fields to analyze relationships between variables. Below are some key applications:
Uses of Pearson Correlation
- Finance and Economics:
- Evaluates the linear relationship between financial metrics such as stock returns and economic indicators.
- Medical Research & Biostatistics:
- Analyzes the correlation between health-related variables like cholesterol levels, blood pressure, and body weight.
- Psychology & Education:
- Measures associations between intelligence scores, academic performance, and psychological traits.
Uses of Spearman Correlation
- Ordinal Data Analysis:
- Useful when analyzing ranked data where the intervals between ranks may not be uniform.
- Sports & Performance Ranking:
- Helps in ranking teams or players in sports based on match outcomes or tournament standings.
- Non-Normal Data Handling:
- Preferred when data is skewed or contains extreme values, as it is less sensitive to outliers than Pearson correlation.
The choice between Pearson and Spearman correlation depends on data characteristics, underlying assumptions, and the nature of the relationship being studied.
Significance of Pearson and Spearman Correlation
The importance of Pearson and Spearman correlation lies in their ability to quantify relationships between variables and identify patterns in data. Some key reasons why they are significant include:
- Measuring Relationships:
- Both methods assign numerical values that reflect the strength and direction of associations between variables.
- Understanding Correlation Coefficients:
- A correlation coefficient close to 1 suggests a strong positive relationship, while a value near -1 indicates a strong negative relationship. A coefficient near 0 implies little or no correlation.
- Recognizing Patterns & Trends:
- These correlation techniques help researchers and analysts detect trends in data, guiding decision-making and hypothesis testing.
Implementation of Pearson correlation and Spearman correlation
let’s see an example where Pearson correlation alone is not sufficient for drawing a conclusion.Imagine if we have two arrays x and y. There is a positive correlation in most of the rows, which means that as x increases, y also increases.

from scipy.stats import spearmanr,pearsonr
x=[10,10,20,30,40,50,60,80,100,1000]
y=[1,2,3,5,8,9,10,10,12,3]
print("Pearson corr is :",pearsonr(x,y)[0] )
print("spearman corr is :",spearmanr(x,y)[0] )
Pearson corr is : -0.2049929070684498
spearman corr is : 0.6972509667751358
Now that we know there’s an outlier in the data, we can remove it from the sample and recalculate the Pearson (P) and Spearman (S) correlation. This time P and S are a lot closer to each other.
from scipy.stats import spearmanr,pearsonr
x=[10,10,20,30,40,50,60,80,100]
y=[1,2,3,5,8,9,10,10,12]
print("Pearson corr is :",pearsonr(x,y)[0] )
print("spearman corr is :",spearmanr(x,y)[0] )

Pearson corr is : 0.9427469176349648
spearman corr is : 0.9915966386554623Conclusion
In summary, both Pearson and Spearman correlation methods play a crucial role in evaluating the strength and direction of relationships between variables. Below are key takeaways regarding their characteristics and uses:
Pearson Correlation:
- Relationship Type: Evaluates linear associations between two continuous variables.
- Assumptions: Requires normality and a linear relationship between variables.
- Outlier Sensitivity: Strongly influenced by outliers, which can distort results.
- Interpretation: Produces values between -1 and 1, where values closer to the extremes indicate stronger linear associations.
- Common Applications: Frequently applied in finance, economics, and psychology when linear patterns are expected.
Spearman Correlation:
- Relationship Type: Assesses monotonic associations and is suitable for ordinal data.
- Assumptions: A non-parametric method that does not require data to follow a normal distribution.
- Outlier Sensitivity: More robust against outliers, making it effective for non-linear relationships.
- Interpretation: Generates values ranging from -1 to 1, reflecting the strength and direction of a monotonic relationship.
- Common Applications: Useful for analyzing ranked data, handling skewed distributions, and situations where linearity cannot be assumed.
Both methods offer valuable insights, and selecting the appropriate correlation technique depends on data characteristics and the nature of the relationship being studied.
Featured Blogs

BCG Digital Acceleration Index

Bain’s Elements of Value Framework
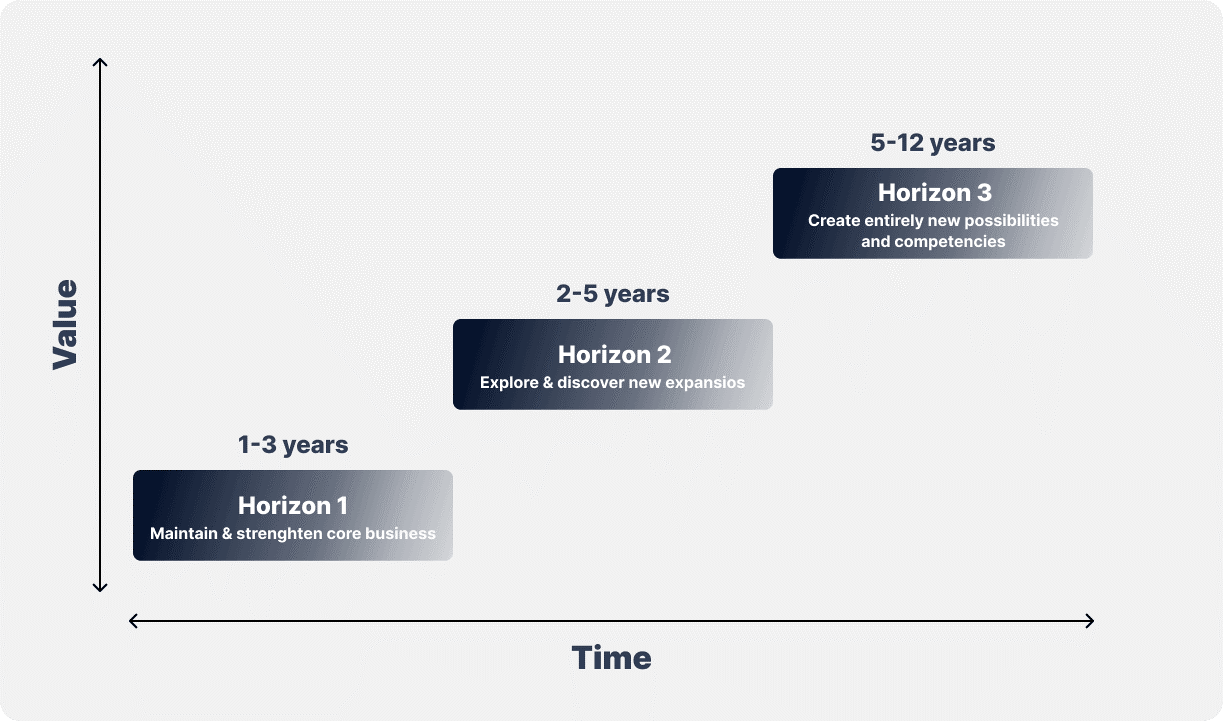
McKinsey Growth Pyramid
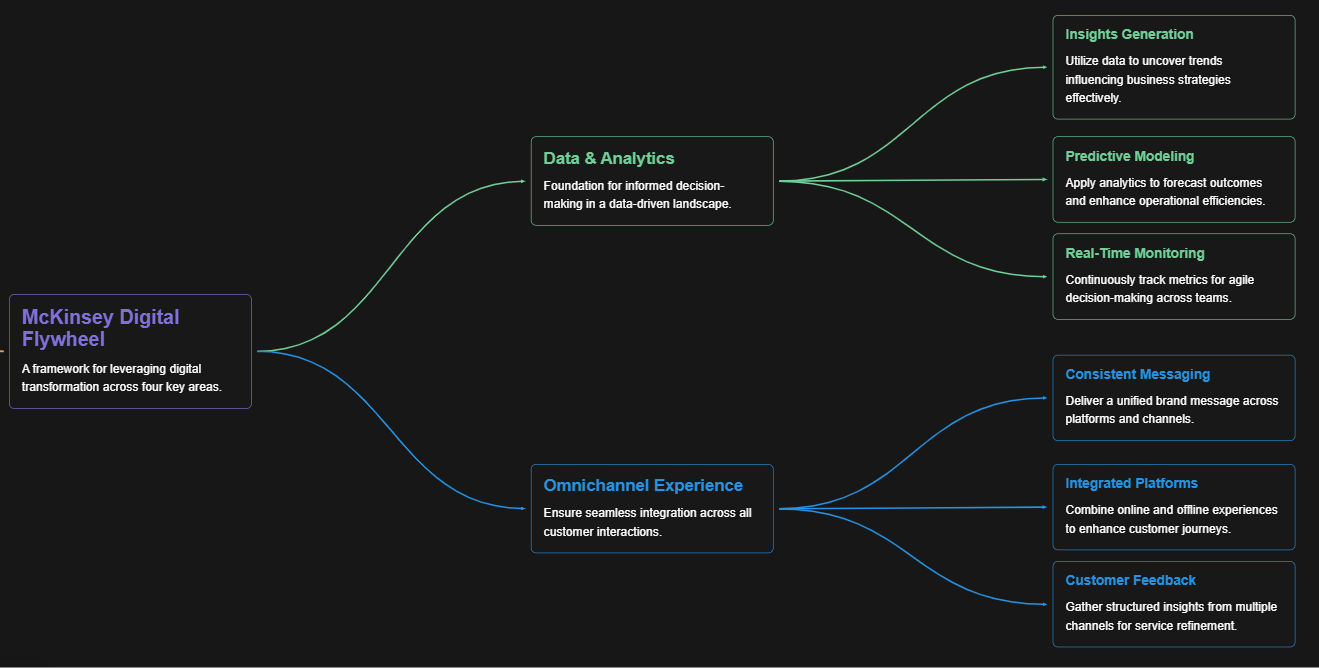
McKinsey Digital Flywheel

McKinsey 9-Box Talent Matrix

McKinsey 7S Framework

The Psychology of Persuasion in Marketing

The Influence of Colors on Branding and Marketing Psychology

What is Marketing?
Recent Blogs

Part 8: From Blocks to Brilliance – How Transformers Became Large Language Models (LLMs) of the series - From Sequences to Sentience: Building Blocks of the Transformer Revolution

Part 7: The Power of Now – Parallel Processing in Transformers of the series - From Sequences to Sentience: Building Blocks of the Transformer Revolution

Part 6: The Eyes of the Model – Self-Attention of the series - From Sequences to Sentience: Building Blocks of the Transformer Revolution

Part 5: The Generator – Transformer Decoders of the series - From Sequences to Sentience: Building Blocks of the Transformer Revolution

Part 4: The Comprehender – Transformer Encoders of the series - From Sequences to Sentience: Building Blocks of the Transformer Revolution of the series - From Sequences to Sentience: Building Blocks of the Transformer Revolution


