Hypothesis Testing
Hypothesis testing is a statistical method used to evaluate assumptions about a population parameter. It helps determine relationships between two statistical variables and provides a structured approach to decision-making based on data.
Real-World Examples:
- A professor believes that 60% of the students at their college belong to lower-middle-class families.
- A physician hypothesizes that a combination of diet, medication dosage, and lifestyle discipline (3D) is 90% effective in managing diabetes.
Hypothesis testing revolves around a fundamental assumption known as the null hypothesis (H₀)—this states that no significant effect or difference exists between the tested variables. The exact nature of the null hypothesis depends on the test type; for example, if testing whether the average age of voters in a state differs from the national average, the null hypothesis would state that there is no difference between the two.
Table of Contents
- Introduction to Hypothesis Testing
- Applications of Hypothesis Testing
- Importance of Hypothesis Testing
- Limitations of Hypothesis Testing
- Implementing Hypothesis Testing in Python
- Conclusion
Introduction to Hypothesis Testing
Hypothesis testing is a fundamental statistical tool that helps infer conclusions about a population based on sample data. Researchers formulate a hypothesis regarding a population parameter and use statistical methods to test its validity.
Key Components of Hypothesis Testing
Null Hypothesis (H₀):
Represents the assumption that no effect, change, or relationship exists.
Alternative Hypothesis (H₁ or Ha):
Suggests that a specific effect, change, or relationship does exist and is typically the hypothesis researchers aim to support.
The purpose of hypothesis testing is to analyze sample data and decide whether to reject the null hypothesis in favor of the alternative hypothesis.
Steps in Hypothesis Testing
Define the Hypotheses:
- Null Hypothesis (H₀): Assumes no change or difference.
- Alternative Hypothesis (H₁ or Ha): Suggests the presence of an effect or difference.
Select the Significance Level (α):
- The probability of incorrectly rejecting the null hypothesis (Type I error).
- Common choices for α include 0.05 (5%), 0.01 (1%), and 0.10 (10%).
Choose an Appropriate Statistical Test:
- Depends on data type, distribution, sample size, and whether the hypothesis is one-tailed or two-tailed.
- Common tests include t-tests, chi-square tests, ANOVA, and regression analysis.
Gather Data:
- The sample data must accurately represent the population to ensure meaningful conclusions.
Compute the Test Statistic:
- A value that quantifies the difference between observed and expected results under the null hypothesis.
Calculate the p-value:
- The probability of obtaining results at least as extreme as the observed outcome if the null hypothesis is true.
- If p ≤ α, reject the null hypothesis (evidence supports the alternative hypothesis).
- If p > α, fail to reject the null hypothesis (insufficient evidence to support the alternative hypothesis).
Draw Conclusions and Report Results:
- Summarize findings, including the test statistic, p-value, and decision regarding the hypotheses.
Types of Hypothesis Tests
Z-Test:
- Determines if there is a significant difference between means.
- Used when the population standard deviation is known and the sample size is ≥ 30.
T-Test:
- Compares means of two groups to assess significant differences.
- Commonly used in small sample sizes when the population standard deviation is unknown.
Chi-Square Test:
- Evaluates whether observed categorical data differ from expected values.
- Useful for analyzing relationships between categorical variables.
Simple vs. Composite Hypothesis:
- Simple Hypothesis: Specifies an exact value for a parameter.
- Composite Hypothesis: Specifies a range of possible values.
- Example: If a company claims quarterly sales are exactly 1,000 units, it's a simple hypothesis. If they claim sales range from 900 to 1,000 units, it's a composite hypothesis.
One-Tailed vs. Two-Tailed Tests:
- One-Tailed Test: Checks whether a sample is significantly greater or lesser than a specified value.
- Two-Tailed Test: Evaluates if a sample differs in either direction (higher or lower) from a reference value.
Errors in Hypothesis Testing
Type I Error (False Positive):
- Occurs when the null hypothesis is rejected even though it is true.
Type II Error (False Negative):
- Occurs when the null hypothesis is not rejected, even though it is false.
Applications of Hypothesis Testing
Hypothesis testing is widely used in different fields to support data-driven decisions:
Medicine & Healthcare:
- Used in clinical trials to determine the effectiveness of new treatments or drugs.
Biology & Genetics:
- Helps identify associations between genetic traits and medical conditions.
Psychology & Social Sciences:
- Assesses the impact of interventions, behavioral patterns, and therapy outcomes.
Economics & Business:
- Evaluates the effects of policies, market trends, and financial predictions.
Education:
- Analyzes the effectiveness of different teaching methodologies.
Significance of Hypothesis Testing
Enables Objective Decision-Making:
- Reduces subjectivity by relying on statistical evidence.
Supports Scientific Research:
- Essential for validating new theories and findings in various disciplines.
Facilitates Evidence-Based Decisions:
- Ensures that conclusions are drawn from data rather than assumptions.
Aids in Clinical & Policy Decisions:
- Helps determine the efficacy of medical treatments and social policies.
Quality Control & Process Optimization:
- Used in manufacturing to maintain product quality and improve efficiency.
Limitations of Hypothesis Testing
Cannot Prove Absolute Truth:
- It only provides evidence for or against a hypothesis, not definitive proof.
Results Depend on the Sample:
- Findings are specific to the sample used and may not always generalize to the entire population.
Potential for Errors:
- Type I (false positive) and Type II (false negative) errors can impact conclusions.
Assumptions & Constraints:
- Different tests require specific assumptions, such as normality and sample size, for accurate results.
Implementation of Hypothesis Testing in Python
# Problem Statement:
Z-Test for Average Weight
A nutritionist claims that the average weight of adults in a city is 70 kg. A random sample of 30 adults from the city is taken, and the sample's average weight is 72 kg. The population standard deviation is known to be 5 kg. We want to test whether the sample mean significantly differs from the population mean using a Z-test at a 5% significance level.

Hypotheses:
Null Hypothesis (H0):
The average weight of adults in the city is 70 kg. (µ = 70)
Alternative Hypothesis (H1):
The average weight of adults in the city is different from 70 kg. (µ ≠ 70)

Given Data:
* Population mean (𝜇=70)
* Sample mean (𝑋ˉ=72)
* Population standard deviation (𝜎=5)
* Sample size (𝑛=30)
* Significance level (𝛼=0.05)

import numpy as np
from scipy.stats import norm

# Step 1: Define the given data
population_mean = 70   # Population mean (mu)
sample_mean = 72       # Sample mean (X-bar)
population_std = 5     # Population standard deviation (sigma)
sample_size = 30       # Sample size (n)
alpha = 0.05           # Significance level

# Step 2: Calculate the Z-statistic
z_statistic = (sample_mean - population_mean) / (population_std / np.sqrt(sample_size))

# Step 3: Calculate the p-value for the two-tailed test
p_value = 2 * (1 - norm.cdf(np.abs(z_statistic)))

# Step 4: Display the results
print(f'Z-statistic: {z_statistic:.4f}')
print(f'P-value: {p_value:.4f}')

# Step 5: Interpret the results
if p_value < alpha:
    print('The difference is statistically significant. We reject the null hypothesis.')
else:
    print('There is no statistically significant difference. We fail to reject the null hypothesis.')

# Explanation:
Z-statistic:
We calculate how far the sample mean is from the population mean in terms of the standard error.
P-value:
We calculate the two-tailed p-value using the cumulative distribution function (CDF) of the standard normal distribution (norm.cdf). The p-value tells us the probability of observing such a difference between the sample mean and the population mean, assuming the null hypothesis is true.

Decision:
If the p-value is less than the significance level (0.05), we reject the null hypothesis and conclude that there is a significant difference between the sample mean and the population mean.

Interpretation:
Since the p-value (0.0285) is less than the significance level (0.05), we reject the null hypothesis. This means there is enough evidence to suggest that the average weight of the sampled adults is significantly different from 70 kg.Conclusion
Hypothesis testing is a crucial statistical technique that offers a structured method for analyzing data and making informed decisions based on sample observations. Below are the key takeaways summarizing its significance:
Objective and Purpose:
- This method is used to assess assumptions about population characteristics, relationships, or effects, allowing researchers and analysts to make data-driven decisions.
Hypothesis Formulation:
- The process begins with defining two opposing hypotheses: the null hypothesis (H₀), which assumes no effect or difference, and the alternative hypothesis (H₁), which suggests the presence of a significant effect or relationship.
Statistical Testing Methods:
- Various statistical techniques—such as t-tests, chi-square tests, ANOVA, and regression analysis—are applied depending on the nature of the data and research objectives.
Decision-Making Framework:
- Hypothesis testing follows a systematic approach where researchers set a significance level (alpha), analyze the collected data, compute a test statistic and p-value, and compare the p-value with alpha to determine whether to reject the null hypothesis.
Significance Level and Error Consideration:
- The significance level (α) indicates the probability of a Type I error (rejecting a true null hypothesis). The most commonly used values are 0.05 (5%) or 0.01 (1%), ensuring a balance between reliability and sensitivity.
In conclusion, hypothesis testing is an essential analytical tool that strengthens the reliability and accuracy of research findings. When applied correctly, it enhances the validity of scientific investigations and decision-making processes across various disciplines.
Featured Blogs

BCG Digital Acceleration Index

Bain’s Elements of Value Framework
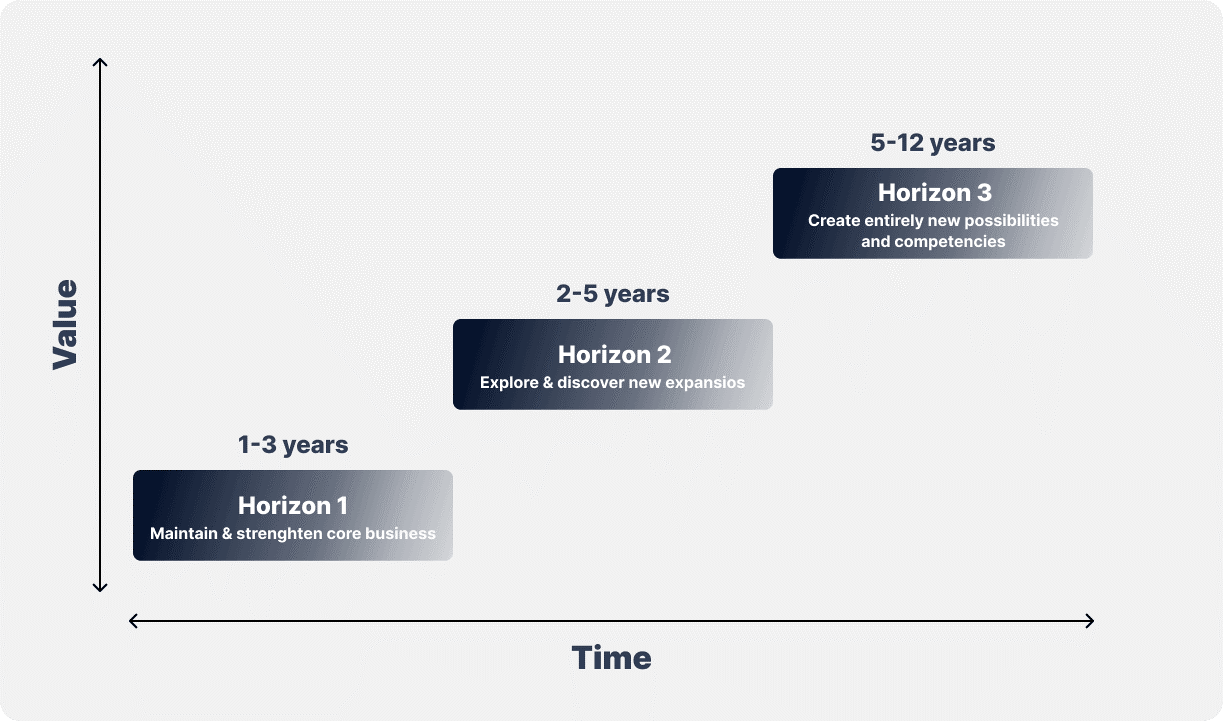
McKinsey Growth Pyramid
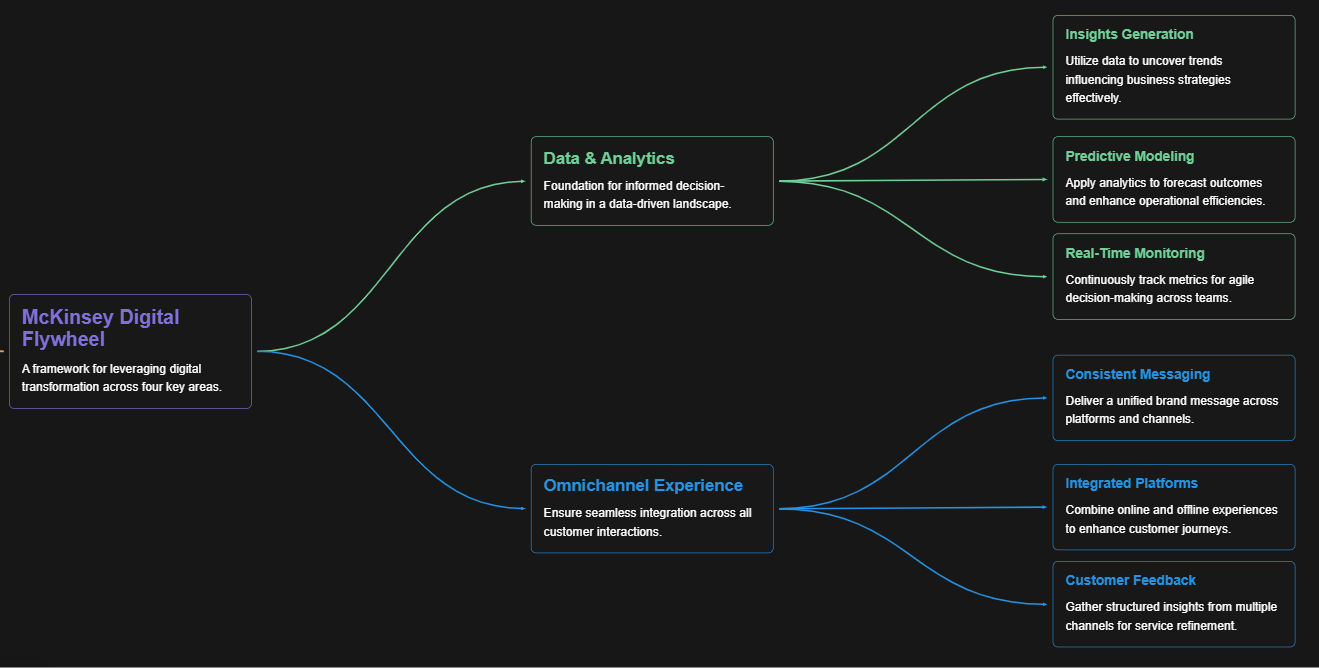
McKinsey Digital Flywheel

McKinsey 9-Box Talent Matrix

McKinsey 7S Framework
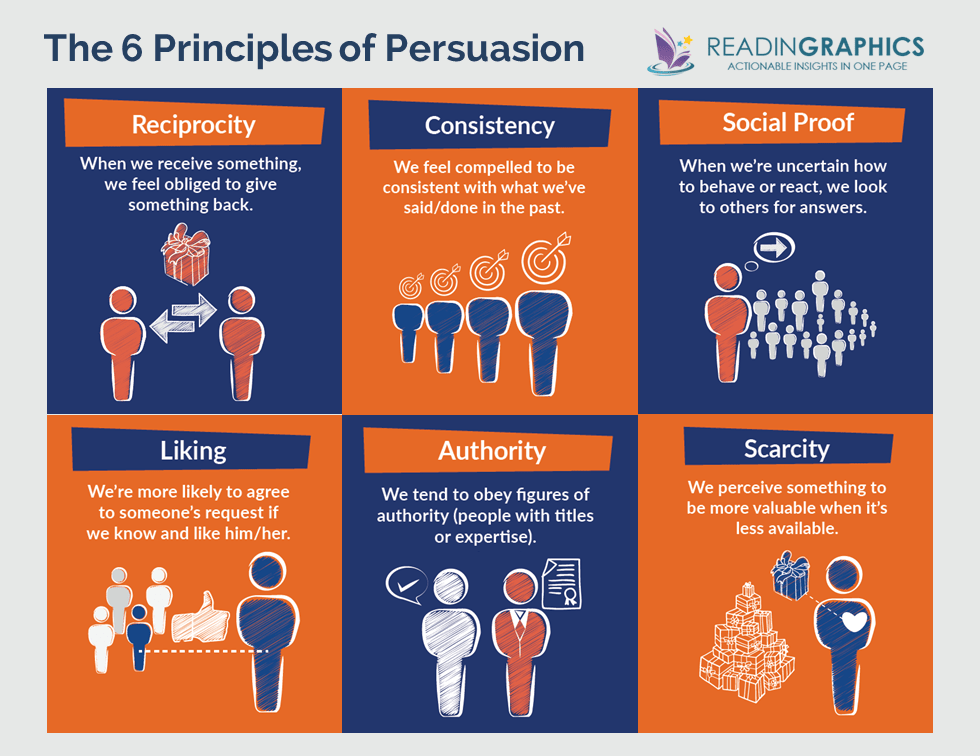
The Psychology of Persuasion in Marketing

The Influence of Colors on Branding and Marketing Psychology

What is Marketing?
Recent Blogs

Part 8: From Blocks to Brilliance – How Transformers Became Large Language Models (LLMs) of the series - From Sequences to Sentience: Building Blocks of the Transformer Revolution

Part 7: The Power of Now – Parallel Processing in Transformers of the series - From Sequences to Sentience: Building Blocks of the Transformer Revolution

Part 6: The Eyes of the Model – Self-Attention of the series - From Sequences to Sentience: Building Blocks of the Transformer Revolution

Part 5: The Generator – Transformer Decoders of the series - From Sequences to Sentience: Building Blocks of the Transformer Revolution

Part 4: The Comprehender – Transformer Encoders of the series - From Sequences to Sentience: Building Blocks of the Transformer Revolution of the series - From Sequences to Sentience: Building Blocks of the Transformer Revolution


