Measures of Dispersion
Measures of dispersion quantify the spread or variability of a dataset. They provide insights into how much the data points deviate from the central tendency (mean, median, or mode). Common measures include range, variance, standard deviation, and interquartile range (IQR). These metrics help to understand data distribution and are essential for comparing datasets and detecting outliers.
Table of Contents
- Introduction to Measures of Dispersion
- Why Are Measures of Dispersion Important?
- Common Measures of Dispersion - Range, Variance, Standard Deviation, IQR
- Significance of Measures of Dispersion
- Applications of Measures of Dispersion
- Implementation in Python
- Conclusion
Introduction to Measures of Dispersion
Measures of dispersion describe the spread or variability of a dataset. While measures of central tendency (mean, median, mode) provide information about the central value, measures of dispersion indicate how data points are distributed around the central value. Dispersion helps to understand the reliability, consistency, and predictability of the data.
Why Are Measures of Dispersion Important?
- Assessing Variability: It provides insights into how much data varies from the average.
- Comparing Datasets: Helps in comparing the spread of two or more datasets.
- Identifying Outliers: Large dispersion can indicate the presence of extreme values.
- Understanding Data Reliability: Lower dispersion implies more consistency in the data.
Common Measures of Dispersion
1. Range
![]()
- Advantages: Simple to compute.
- Disadvantages: Sensitive to outliers.
2. Variance

The average of the squared differences between each data point and the mean, representing the overall spread of the data.
3. Standard Deviation
![]()
The square root of the variance, measuring the average deviation of data points from the mean in the same unit as the data.
4. Interquartile Range (IQR)
![]()
The range of the middle 50% of the data, calculated as the difference between the third quartile (Q3) and the first quartile (Q1).
Significance of Measures of Dispersion
- Understanding Variability: Helps to measure the consistency or predictability of a dataset.
- Decision-Making: Aids in informed decision-making in fields like finance, healthcare, and engineering.
- Data Comparison: Facilitates comparisons between datasets with similar central tendencies but differing variabilities.
- Error Analysis: Identifies the reliability of experimental data by measuring deviations
Applications of Measures of Dispersion
- Finance: Assessing the risk of investment portfolios by analyzing variability in returns.
- Quality Control: Ensuring consistency in manufacturing processes.
- Climate Science: Measuring temperature variability across regions.
- Education: Comparing students performance across different exams.
- Sports: Analyzing players performance consistency.
Implementation in Python

Conclusion
Measures of dispersion are indispensable for statistical analysis, offering a deeper understanding of data variability and distribution. By implementing these measures in Python, analysts and researchers can efficiently explore data characteristics, draw meaningful conclusions, and make data-driven decisions. Mastery of these concepts is fundamental for any data analysis or statistical project.
Featured Blogs

BCG Digital Acceleration Index

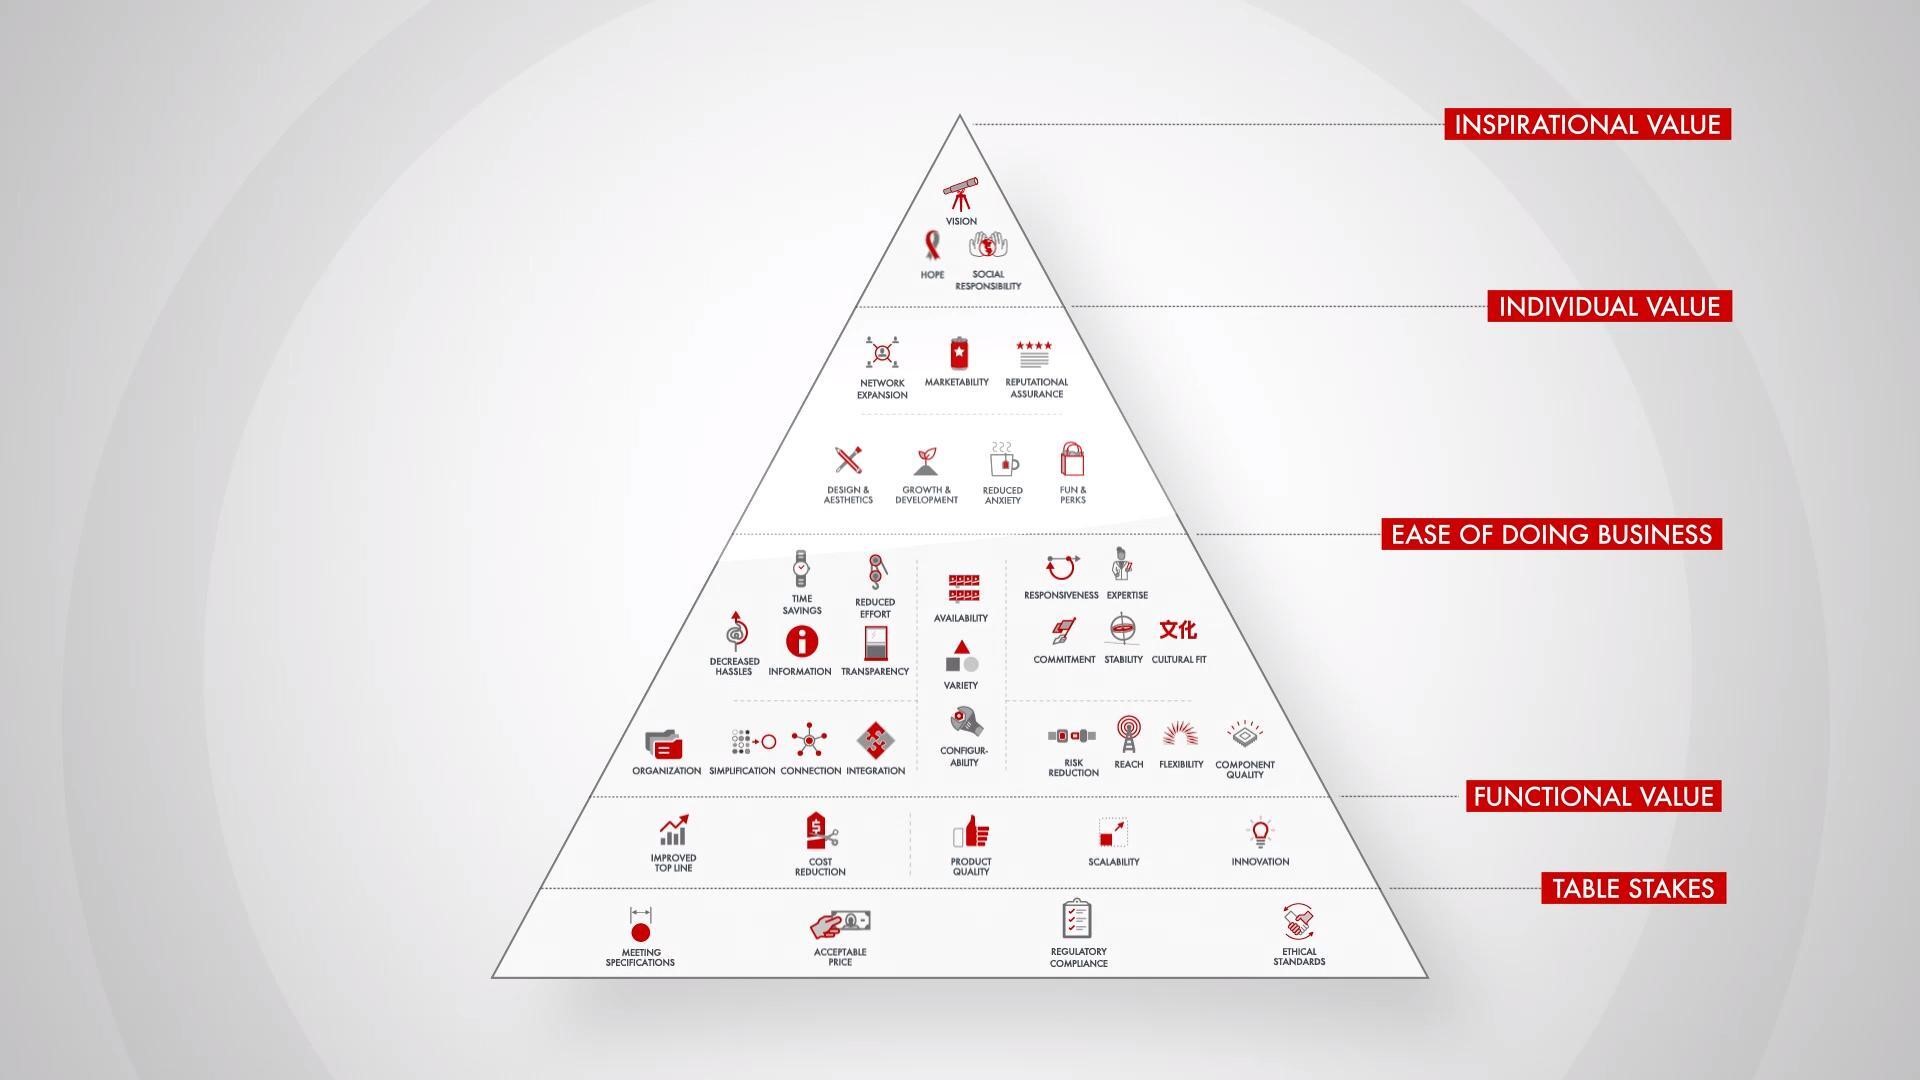
Bain’s Elements of Value Framework

McKinsey Growth Pyramid

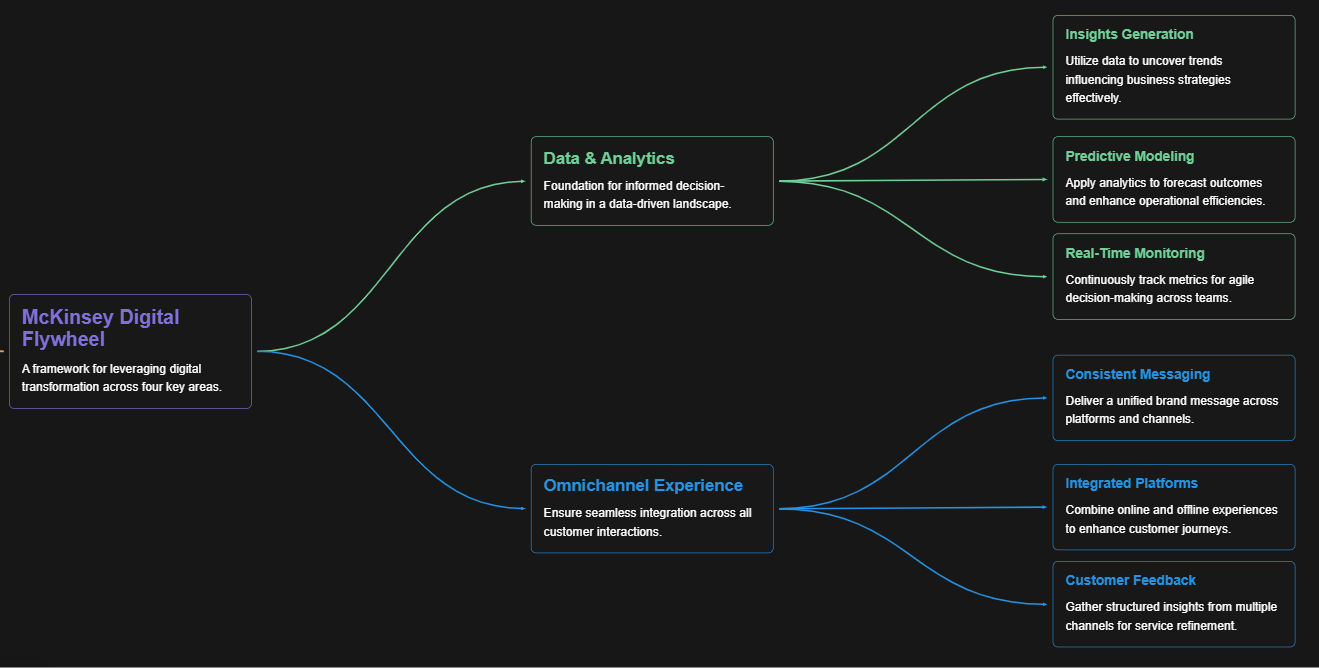
McKinsey Digital Flywheel

McKinsey 9-Box Talent Matrix

McKinsey 7S Framework

The Psychology of Persuasion in Marketing

The Influence of Colors on Branding and Marketing Psychology

What is Marketing?
Recent Blogs

Part 8: From Blocks to Brilliance – How Transformers Became Large Language Models (LLMs) of the series - From Sequences to Sentience: Building Blocks of the Transformer Revolution

Part 7: The Power of Now – Parallel Processing in Transformers of the series - From Sequences to Sentience: Building Blocks of the Transformer Revolution

Part 6: The Eyes of the Model – Self-Attention of the series - From Sequences to Sentience: Building Blocks of the Transformer Revolution

Part 5: The Generator – Transformer Decoders of the series - From Sequences to Sentience: Building Blocks of the Transformer Revolution

Part 4: The Comprehender – Transformer Encoders of the series - From Sequences to Sentience: Building Blocks of the Transformer Revolution of the series - From Sequences to Sentience: Building Blocks of the Transformer Revolution


