Data Visualization Tools for Marketers
1. Introduction: The Power of Visual Communication in Marketing Analytics
In today's data-rich environment, marketers are inundated with information from various sources. However, raw data alone provides little value without effective interpretation and communication. Data visualization tools transform complex datasets into easily understandable visual formats, such as charts, graphs, and maps, enabling marketers to identify trends, gain insights, and make informed decisions.
This article explores the importance of data visualization, key types of visualization tools, their applications in marketing, challenges in implementation, and the future of AI-enhanced visualization.
2. The Importance of Data Visualization: Transforming Data into Actionable Insights
Data visualization plays a critical role in modern marketing by:
a) Enhancing Understanding:
- Description: Simplifying complex data and making it accessible to a broader audience.
- Benefit: Marketers can quickly grasp key trends and patterns without extensive statistical knowledge.
b) Facilitating Communication:
- Description: Presenting data in a clear, concise, and visually appealing manner for effective communication across teams and stakeholders.
- Benefit: Stakeholders can easily understand marketing performance and make informed decisions.
c) Enabling Discovery:
- Description: Revealing hidden patterns, correlations, and outliers that might be missed in raw data.
- Benefit: Marketers can identify new opportunities and insights to improve campaign performance.
d) Supporting Decision-Making:
- Description: Providing data-driven insights to guide strategic decisions and optimize marketing spend.
- Benefit: Marketers can allocate resources more effectively and maximize ROI.
3. Key Types of Data Visualization Tools for Marketers
Several data visualization tools cater to the diverse needs of marketers:
a) Basic Charting Tools:
- Description: Tools for creating standard charts and graphs, such as bar charts, line graphs, and pie charts.
- Examples: Microsoft Excel, Google Sheets.
- Use Cases: Presenting basic marketing metrics like website traffic, conversion rates, and sales figures.
b) Business Intelligence (BI) Platforms:
- Description: Comprehensive platforms for data analysis, visualization, and reporting.
- Examples: Tableau, Power BI, Qlik Sense.
- Use Cases: Creating interactive dashboards, analyzing marketing campaign performance, and identifying trends in customer behavior.
c) Data Visualization Libraries:
- Description: Programming libraries for creating custom visualizations.
- Examples: D3.js, Python's Matplotlib and Seaborn.
- Use Cases: Developing specialized visualizations for complex datasets, such as network graphs or geographic maps.
d) Marketing Analytics Platforms:
- Description: Tools specifically designed for marketing data, offering built-in visualizations and reporting capabilities.
- Examples: Google Analytics, Adobe Analytics, HubSpot.
- Use Cases: Tracking website traffic, analyzing user behavior, and measuring the effectiveness of marketing campaigns.
e) Social Media Analytics Tools:
- Description: Platforms for visualizing social media data, such as engagement metrics, sentiment analysis, and audience demographics.
- Examples: Hootsuite, Sprout Social, Brandwatch.
- Use Cases: Monitoring brand mentions, analyzing social media campaign performance, and identifying influencers.
4. Applications of Data Visualization in Marketing
Data visualization tools can be applied across various marketing functions:
a) Campaign Performance Analysis:
- Description: Visualizing campaign metrics to understand what's working and what's not.
- Examples: Tracking ad impressions, click-through rates, and conversion rates in a dashboard.
b) Customer Segmentation:
- Description: Creating visual representations of customer segments to identify key characteristics and behaviors.
- Examples: Using scatter plots or heatmaps to visualize customer demographics, purchase history, and engagement patterns.
c) Website Analytics:
- Description: Analyzing website traffic, user behavior, and conversion funnels.
- Examples: Visualizing user flow through a website, identifying drop-off points, and tracking page performance.
d) Social Media Monitoring:
- Description: Tracking brand mentions, sentiment, and engagement on social media.
- Examples: Creating word clouds to visualize trending topics, mapping social media sentiment over time, and identifying influencers.
e) Marketing ROI Measurement:
- Description: Visualizing the return on investment for different marketing activities.
- Examples: Creating dashboards to track marketing spend, revenue, and customer lifetime value.
5. Best Practices for Effective Data Visualization
To create impactful visualizations, marketers should follow these best practices:
a) Define the Purpose:
- Description: Clearly identify the goal of the visualization and the insights you want to communicate.
b) Choose the Right Chart Type:
- Description: Select a chart type that is appropriate for the data and the message you want to convey.
c) Keep it Simple:
- Description: Avoid clutter and unnecessary elements that can distract from the main message.
d) Use Clear Labels and Titles:
- Description: Ensure that all axes, labels, and titles are clear, concise, and easy to understand.
e) Use Color Strategically:
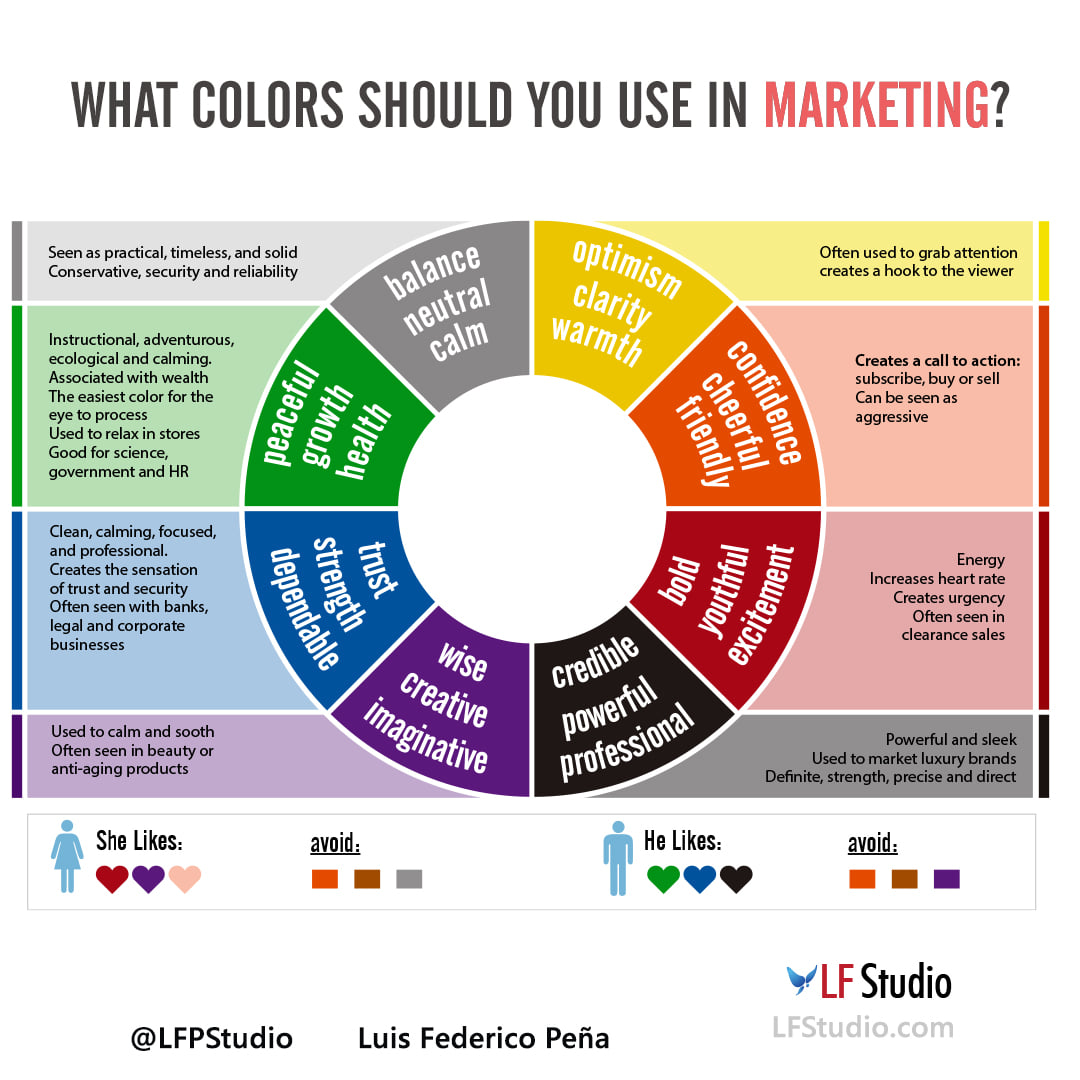
- Description: Use color to highlight important information and create visual appeal, but avoid using too many colors.
6. Challenges in Implementing Data Visualization
Despite their benefits, data visualization tools can present challenges:
a) Data Quality:
- Challenge: Inaccurate or incomplete data can lead to misleading visualizations.
- Solution: Implement data quality checks and validation processes.
b) Tool Selection:
- Challenge: Choosing the right tool for specific needs and skills can be difficult.
- Solution: Evaluate different tools based on functionality, ease of use, and integration capabilities.
c) Interpretation:
- Challenge: Misinterpreting visualizations can lead to incorrect conclusions.
- Solution: Provide training on data literacy and visualization best practices.
d) Security and Privacy:
- Challenge: Protecting sensitive data and ensuring compliance with privacy regulations.
- Solution: Implement data security measures and adhere to privacy policies.
7. The Future of Data Visualization: AI-Driven Insights
Data visualization is evolving to incorporate AI and machine learning:
a) Automated Insights:
- Trend: AI-powered tools that automatically identify key insights and generate visualizations.
b) Natural Language Processing (NLP):
- Trend: Using NLP to enable users to interact with visualizations using natural language.
c) Augmented Reality (AR) and Virtual Reality (VR):
- Trend: Creating immersive data visualization experiences using AR and VR technologies.
8. Conclusion: Empowering Marketers with Visual Insights
Data visualization tools are essential for modern marketers, enabling them to transform complex data into actionable insights. By selecting the right tools, following best practices, and embracing AI-driven innovations, marketers can unlock the full potential of data and drive better business outcomes. As data continues to grow in volume and complexity, the ability to visualize and communicate insights will become increasingly critical for marketing success.
This comprehensive article provides a detailed overview of data visualization tools, their applications, challenges, and future trends. Please let me know if you would like me to make any further adjustments or refinements.
Featured Blogs
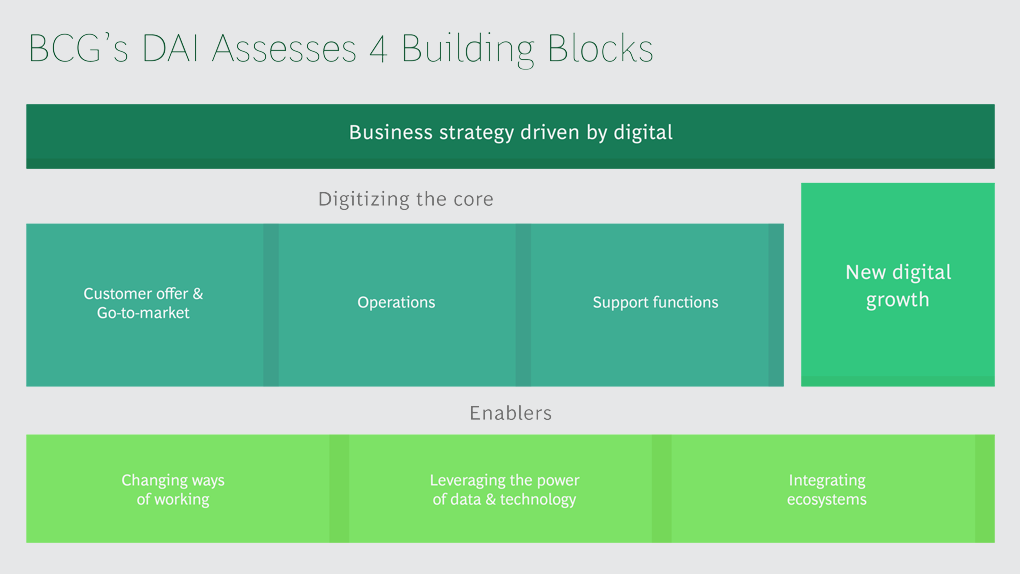
BCG Digital Acceleration Index
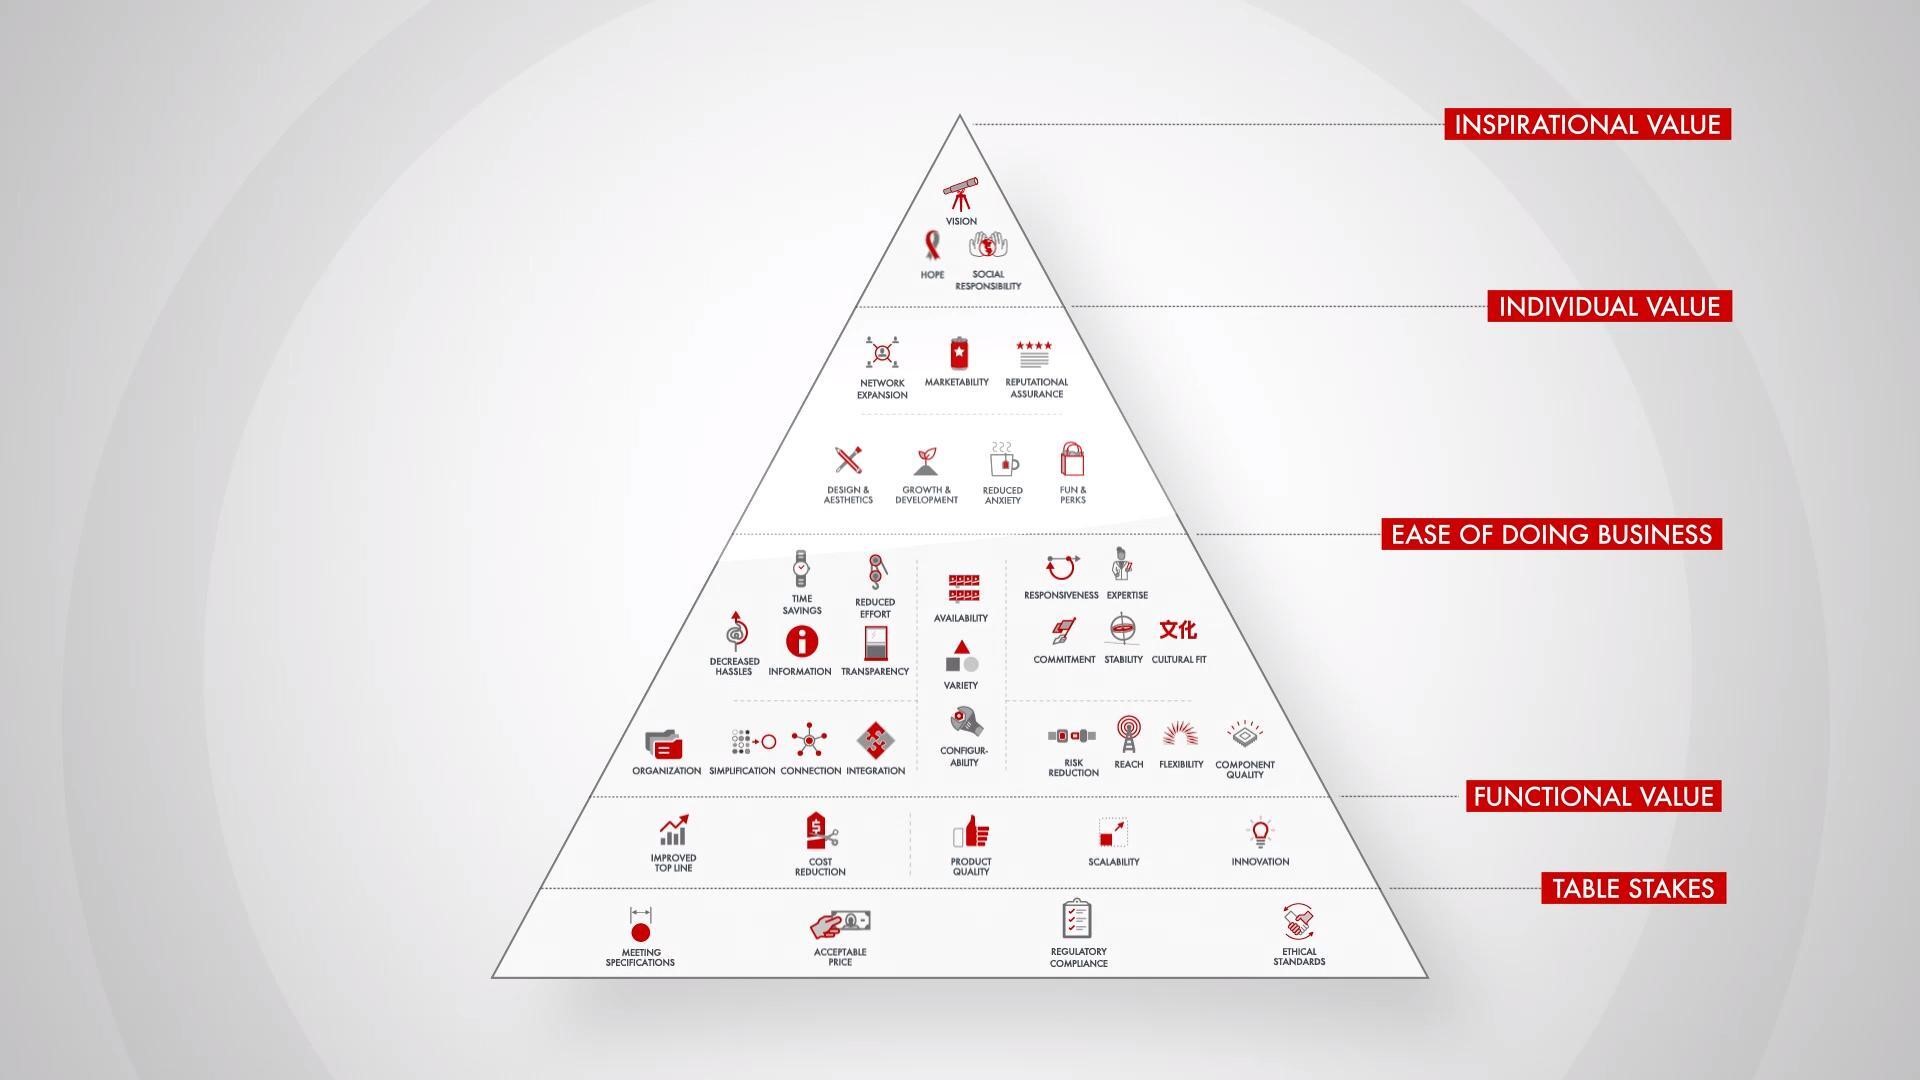
Bain’s Elements of Value Framework
McKinsey Growth Pyramid
McKinsey Digital Flywheel
McKinsey 9-Box Talent Matrix

McKinsey 7S Framework
The Psychology of Persuasion in Marketing
The Influence of Colors on Branding and Marketing Psychology


